Lower Thwaites Glacier
Try using -par 10 when you run rinex2snr and gnssir. Your code should run must faster.
metadata

Station Name: lthw
Location: Thwaites Glacier, Antarctica
Archive: UNAVCO
Ellipsoidal Coordinates:
Latitude: -76.458
Longitude: -107.782
Height: 1011.459 m
Data Summary
The receiver only tracks legacy GPS signals, so only L1 should be used for reflectometry. The pole is set in the snow/ice and routinely (every few years) reset. Please use the Nevada Reno site to get a feel for when the pole has been reset and where data gaps exist.
Because there are no permanent structures surrounding the site, elevation and azimuth angle default settings can mostly be used. The only restriction that should be imposed is a minimum elevation angle of 7; this is because the field crew set this at the receiver when it was originally installed.
Take a quick look at the SNR data
Translate the GPS data for January 1 in 2018. First you need to make the SNR file:
rinex2snr lthw 2018 1
Use our utility quickLook to look at these data.
quickLook lthw 2018 1 -e1 7

This is a bit of a mess really. If there are significant peaks, they are really close to the cutoff for the method (at 0.5 meters). Let’s compare with about a week later. First make a SNR file:
rinex2snr lthw 2018 9
Now run quickLook:
quickLook lthw 2018 9 -e1 7

This is much better and clearly shows that a field crew reset the antenna to a little less than 5 meters sometime between day 1 and day 9 in the year 2018. You can also look at the second plot to get an idea of how well the method performs for various azimuths and QC parameters:

Except for a region ~270-300 degrees in azimuth, and directly south, retrievals are consistently good. A peak to noise ratio of 3 appears to be appropriate. The rejected southern retrievals are unlikely to be of local origin, but rather related to the inclination of the satellite orbits at this latitude.
If you like you can compare this to the first day of 2020, first make the SNR file:
rinex2snr lthw 2020 1
Again use quickLook:

Now the peaks in the reflector height (RH) periodograms are ~2.2 meters - so that means that there was ~2.5 meters of surface change from 2018 to 2020.
Measure Snow Accumulation for 2018
Translate the GPS data for the year of 2018:
rinex2snr lthw 2018 1 -doy_end 365
Then you need to make the list of analysis inputs (stored in json format):
gnssir_input lthw -e1 7 -e2 25 -peak2noise 3.2 -l1 T
Now analyze the data for 2018 from day 1 to day 365 using gnssir:
gnssir lthw 2018 1 -doy_end 365
This produces reflector heights for every rising and setting satellite track that meets your quality control selections. In order to estimate snow accumulation, you will want to calculate the daily average. Using our daily_avg utility - and specifying 50 satellite tracks and median filter of 0.25 meters:
daily_avg lthw 0.25 50
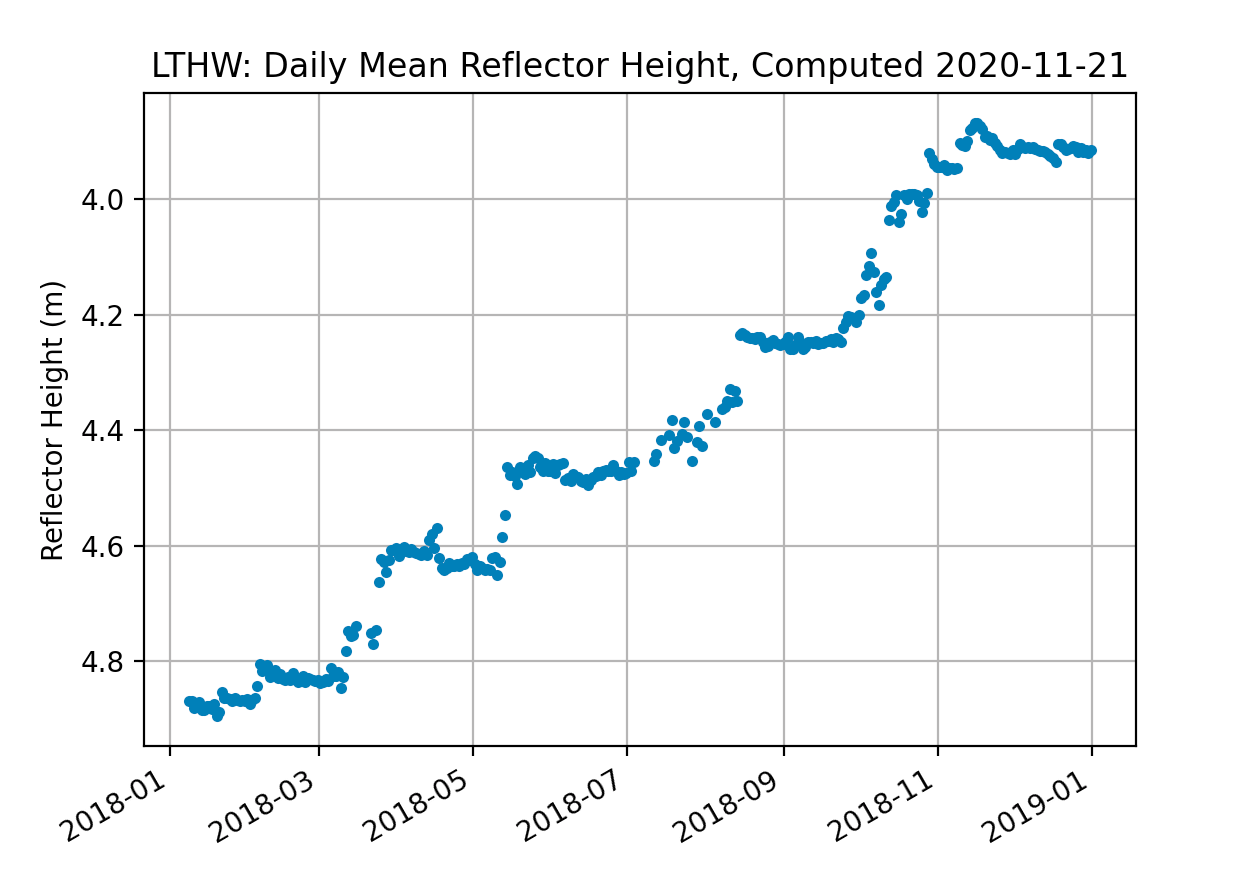
You can loosen the required track number if you want, but in this case it does not change the overall character of the results:
daily_avg lthw 0.25 40

Sample daily average RH file for 2018
If you are feeling ambitious, try looking at the data for Upper Thwaites Glacier :-)