#Lake Mathews, Southern California
metadata
Station name: mat2

Latitude: 33.857 degrees
Longitude: -117.437 degrees
Ellipsoidal Height: 398 meters
Data archive: UNAVCO
Pick Up Some Data
This site has a lot of history. It is 1-Hz and multi-GNSS since ~2016. You do not need 1-Hz for this site - but it is definitely better than the default PBO era sampling rate of 15 seconds. Here I have chosen to decimate the 1-Hz data to 5 seconds, as in:
rinex2snr mat2 2022 175 -orb gnss -rate high -dec 5 -archive unavco
Note that you can use the rapid GFZ orbits after mid 2021. And before 2016, there are no multi-GNSS observations, so you can use the default (gps-only) option.
Evaluate the Reflection Data
Use the Reflection Zone WebApp
What RH limits did I use? Azimuths? Elevation angles? Which direction is the water? With that information, then look at the data.
Use quickLook with elevation angles 4-8 degrees and RH 7-35 meters:
quickLook mat2 2022 175 -e1 4 -e2 8 -h1 7 -h2 35
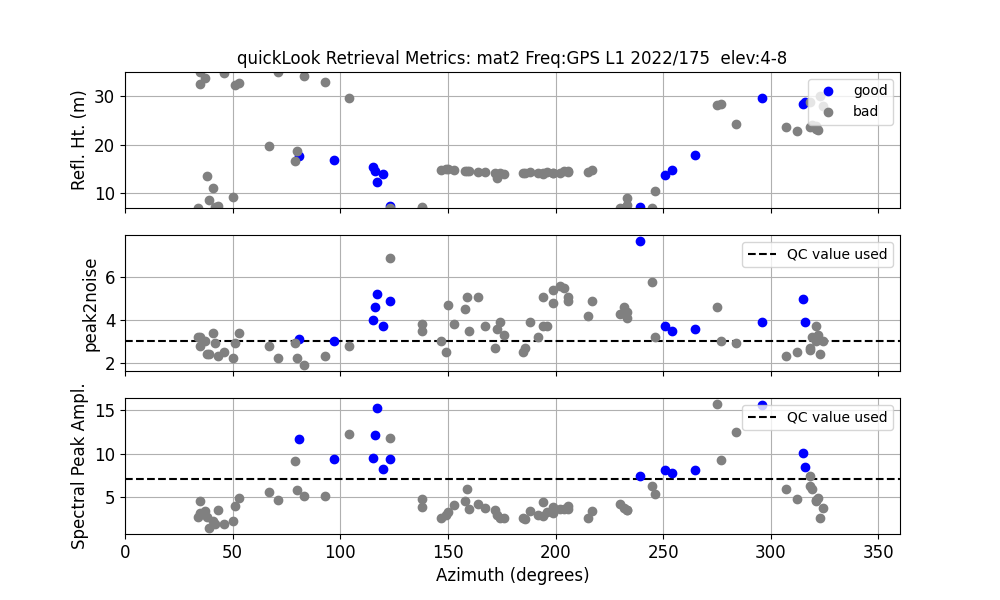
How did I know to use a RH region of 7 to 35 meters? I did not know this initially. I first tried a limit of 20 meters, analyzed multiple years of data and realized that during the drought of 2015 the lake retrievals disappeared (i.e. the RH was greater than 20 meters). I re-analyzed the data using the larger limit. Once you have translated the files, it really doesn’t take much cpu time to re-analyze the data.
What does this image tell us? I know from google maps that the lake is to the south. And there are retrievals to the south, but they are being set to bad because the amplitude of the reflection is so small. You can override that:
quickLook mat2 2022 175 -e1 4 -e2 8 -h1 7 -h2 35 -ampl 0
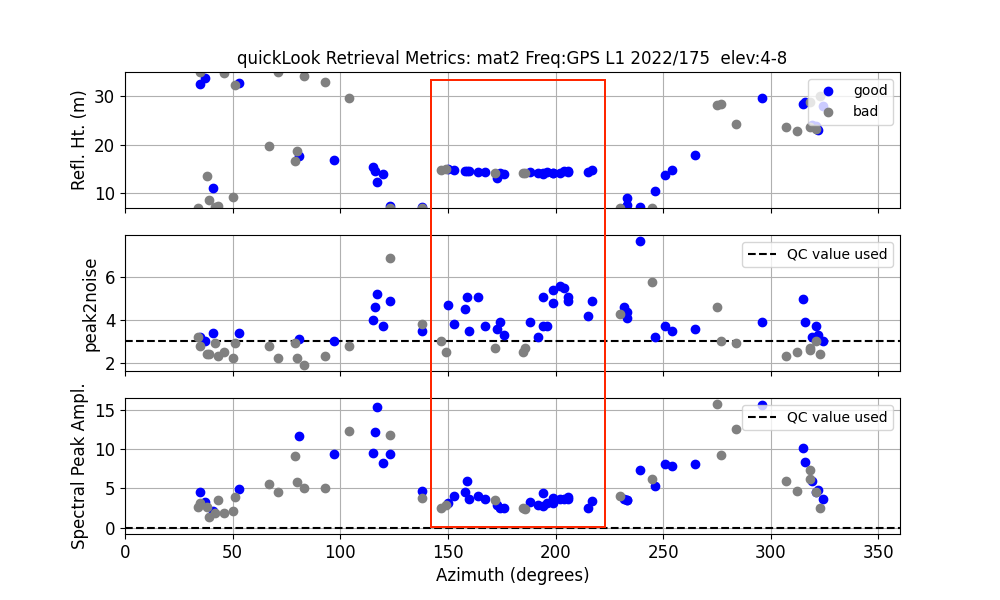
If the amplitude limit is set to zero, the code will rely on the peak of the Lomb Scargle retrieval relative to the noise (peak2noise) for quality control.
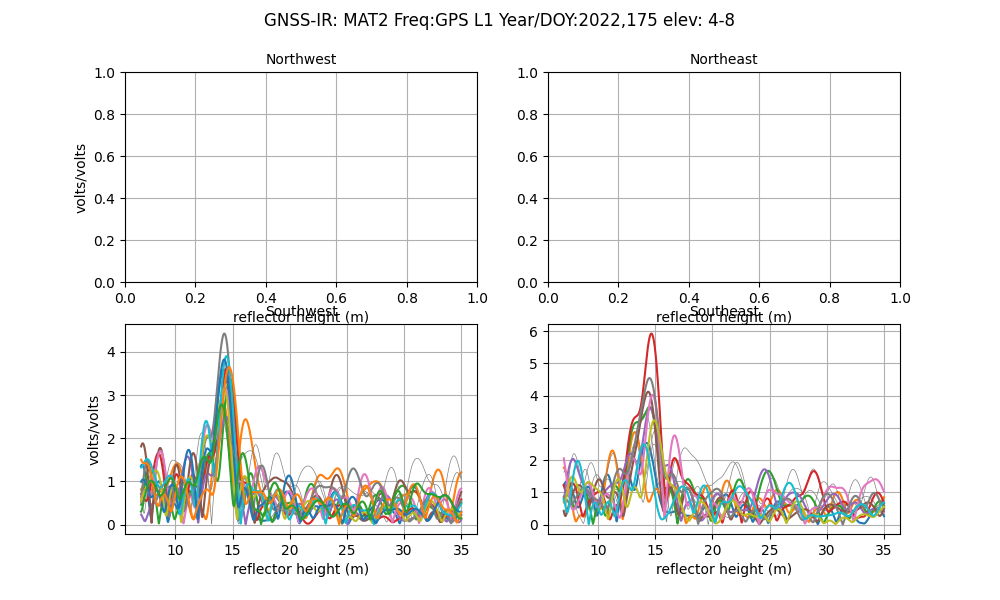
I have manually added a red box to show the good azimuths. If I further edit the correct azimuths, you see good strong returns in the peridograms:
quickLook mat2 2022 175 -e1 4 -e2 8 -h1 7 -h2 35 -ampl 0 -azim1 220 -azim2 275:
Analyze a Fuller Dataset
Once you have the elevation and azimuth angles set (along with details like the required amplitude,
which we are not using here), you really just need to turn the crank. Run gnssir_input using
the information I discussed earlier (i.e. set azimuth and elevation angles limits, RH limits).
Make SNR files using rinex2snr. Then compute reflector heights:
gnssir mat2 2017 1 -year_end 2021 -doy_end 365
This command would analyze all the data from 2017-2021. Use daily_avg to create a daily average.
Play with the inputs (median filter value, number of required RH to compute a reliable average) to make sure
that you have a high quality results. My plot goes back to 2008 because I downloaded more RINEX data:
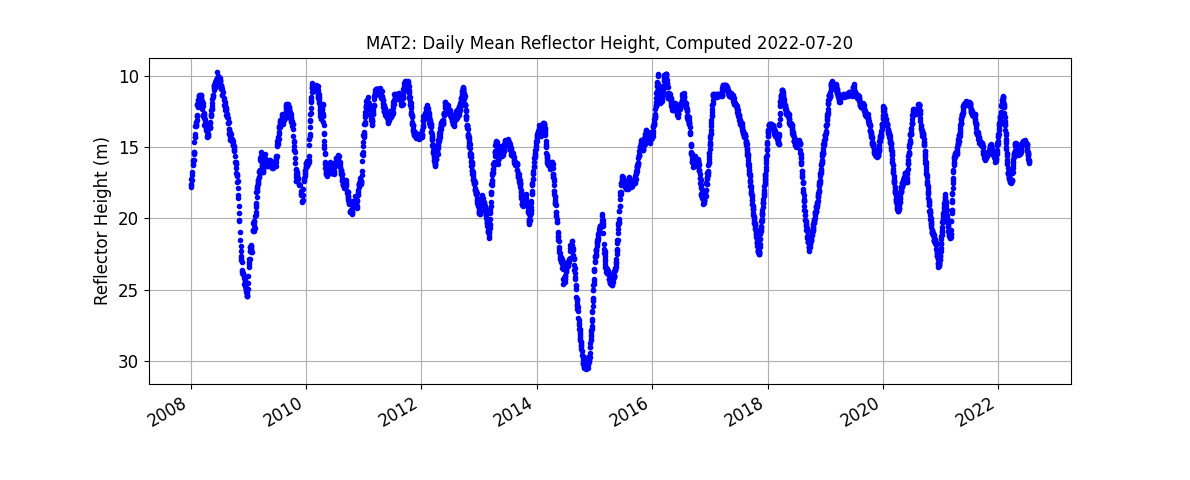
Because there were only useful GPS L1 data in the earlier dataset, I only used it for the entire time series. In general you should use all the good frequenices that are available to you.
In situ data:
Monthly Data from the California Department of Water Resources
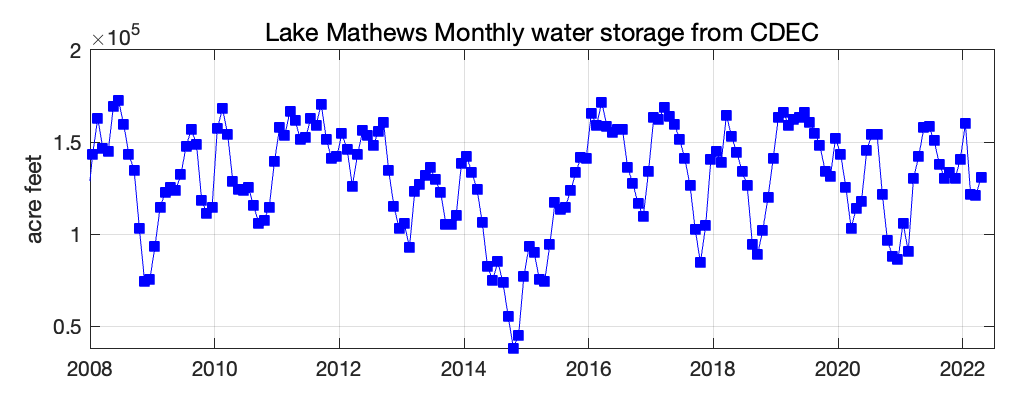
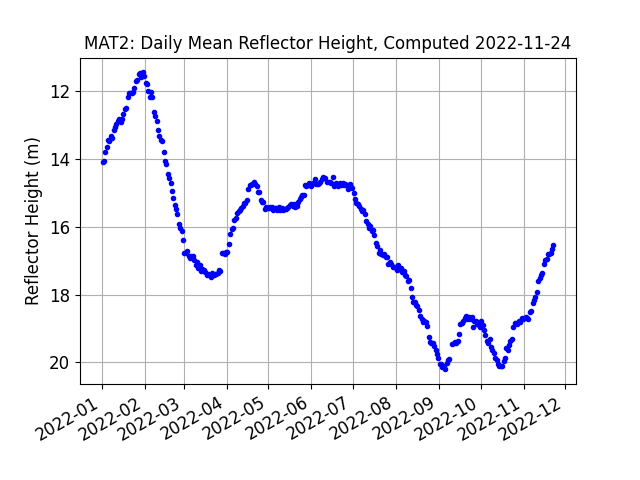
I extended the time series to November 2022. Since the receiver early on only allowed GPS, and the L2 data were “complicated,” these results are not representative of what can be achieved with a modern receiver. However, they are certainly good enough for the daily averages used for a reservoir.
daily_avg mat2 0.25 5 -year1 2022
Updated by Kristine M. Larson, November 24, 2022