Michipicoten, Lake Superior
Updated February 28, 2024 by Kristine Larson
metadata
Station Name: mchn
Location: Michipicoten Harbor, Ontario, Canada
Recommended Archive: SOPAC
Station Page at Natural Resources Canada
Station Page at Nevada Geodetic Laboratory

Data Summary
Station mchn is operated by NRCAN. The station overlooks Lake Superior in a favorable location for measuring seasonal water levels. Unfortunately this site only tracks legacy GPS signals. This seriously degrades what you can do with the data for GNSS-IR.
For GNSS reflectometry, you need to set an azimuth and elevation angle mask. The azimuths are chosen to ensure that the reflected signals reflect off the surface of interest. This site is a bit tricky, as it is not obvious how high the antenna is above the lake, so we can’t just plug in an a priori reflector height.
Evaluate the SNR Data
Make SNR File
If you know where the data are stored (i.e. sopac), it is better (faster) to set that flag. Since the receiver only tracks GPS signals, there is no need to specify gnss orbits.
rinex2snr mchn 2019 205 -archive sopac
Take a Quick Look at the Data
Examine the spectral characteristics of the SNR data for the default settings
quickLook mchn 2019 205
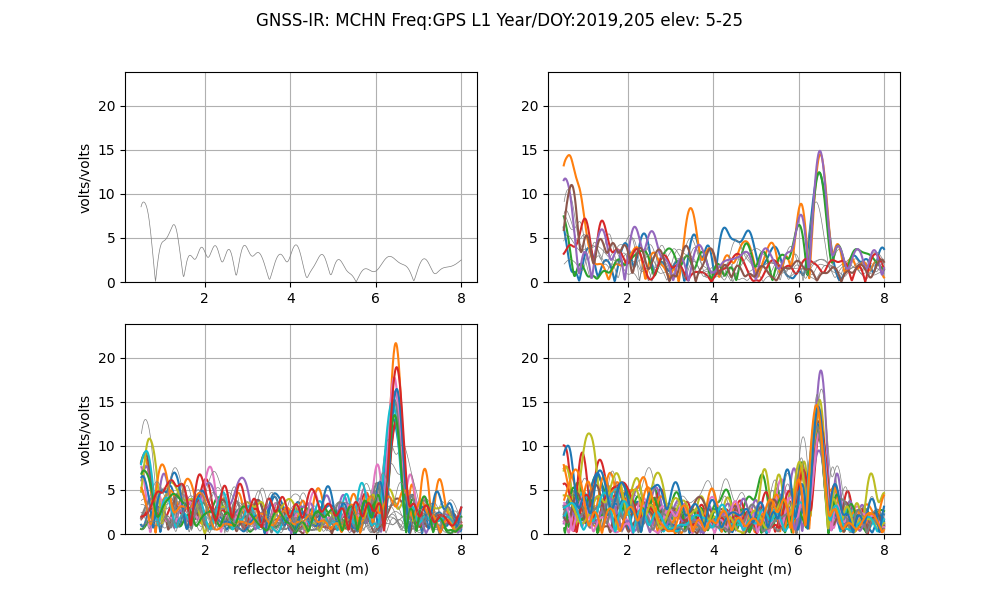
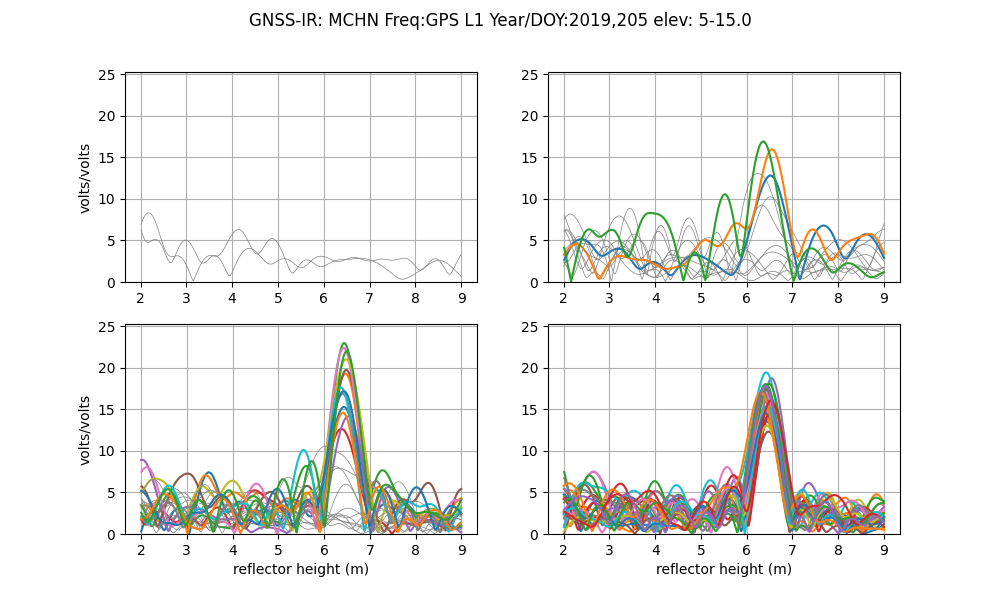
This is helpful - it suggests that the water surface is a bit more than 6 meters below the antenna. For water I mostly use elevation angles of 5-15, but you can certainly try using higher elevation angles. There is also some noise at the low RH values, so I am going to exclude that region:
quickLook mchn 2019 205 -h1 2 -h2 9 -e1 5 -e2 15
Also look at the QC metrics:
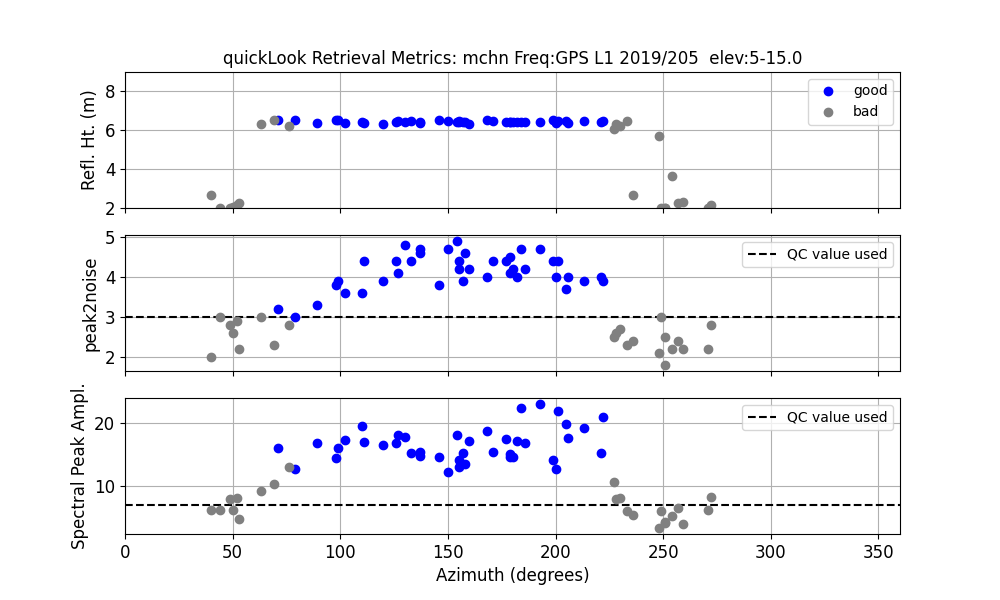
You can see from the top plot that the good retrievals (in blue) very clearly show you which azimuths are acceptable and which are not. The middle plot shows the peak to noise ratio, which looks like we would like to at least exceed 3. The amplitudes in the bottom plot indicate that 8 is an acceptable minimal value using these settings.
Analyze the Data
The data from 2013 will be analyzed here as a test case. Begin by generating the SNR files:
rinex2snr mchn 2013 1 -archive sopac -doy_end 365
The resulting SNR files are stored in $REFL_CODE/2013/snr/mchn.
Analysis parameters are set up with gnssir_input using the default receiver location:
gnssir_input mchn -h1 2 -h2 9 -e1 5 -e2 15 -l1 T -peak2noise 3 -ampl 8 -azlist2 80 180
Although it is possible to get good reflections beyond an azimuth of 180 degrees, the images in Google Earth suggest barriers are present in that region.
Now that the analysis parameters are set, run gnssir to save the
reflector height (RH) output for each day in the year 2013.
gnssir mchn 2013 1 -doy_end 365
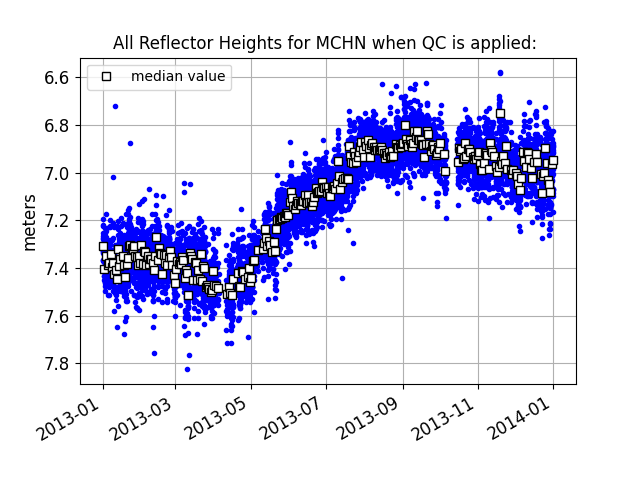
For a lake, it is appropriate to use the daily average. Our utility for computing a daily average requires a value for the median filter and a minimum number of tracks. We will start out with a relatively small number of minimum tracks since this site only has L1 GPS data. But we will update as that value if we like. I often start with 0.25 meters as my “median filter” but it is not a rule!
daily_avg mchn 0.25 10
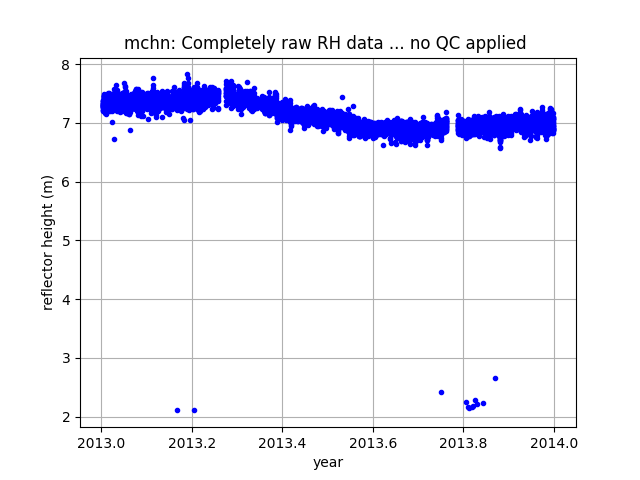
You can see RH values near 2 meters which are not reasonable. We don’t want them to ruin our average. Those values will not agree with the daily median value within 0.25 meters, so will be thrown out.
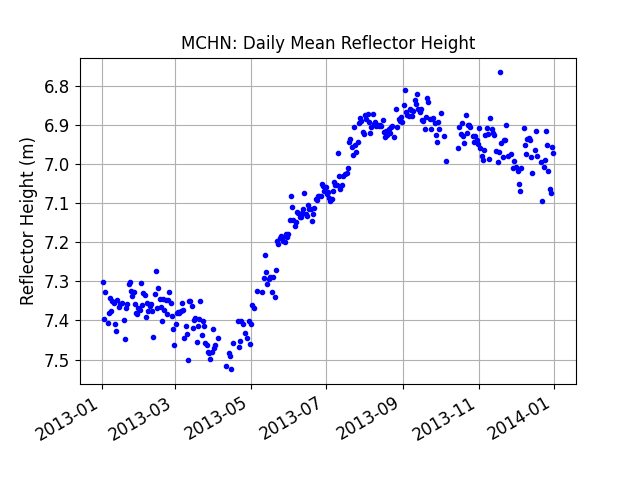
This is not too bad - but I think maybe a bit too much noise. I am going to require more tracks and rerun it.
daily_avg mchn 0.25 20
Daily average results:
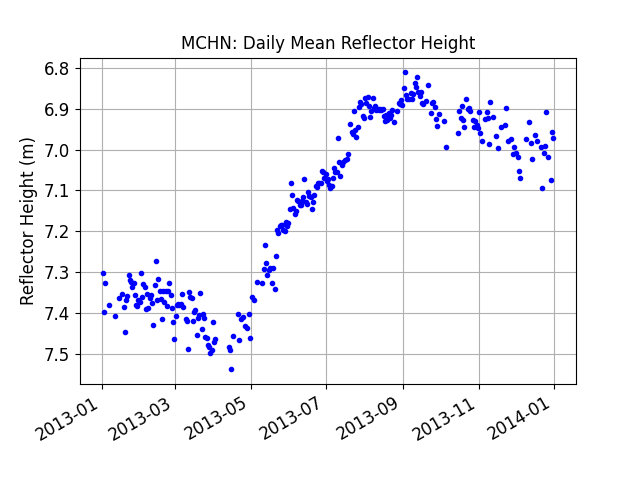
The number of tracks required will depend on the site. Here the azimuth is restricted because of the location of the antenna. One could also allow fewer tracks, but impose a stricter median filter.
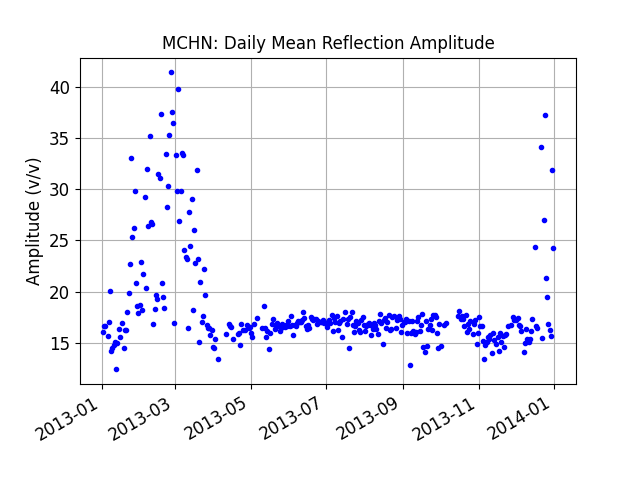
Please note that these reflections are from ice in the winter and water during the summer. This should be take into account when interpreting the results. How do I know this? The biggest clue is related to the daily average amplitude plot. In the winter months the amplitudes are much larger. This is what we expect for ice/snow based on a GNSS-IR simulator developed by Felipe Nievinski.
Comparison
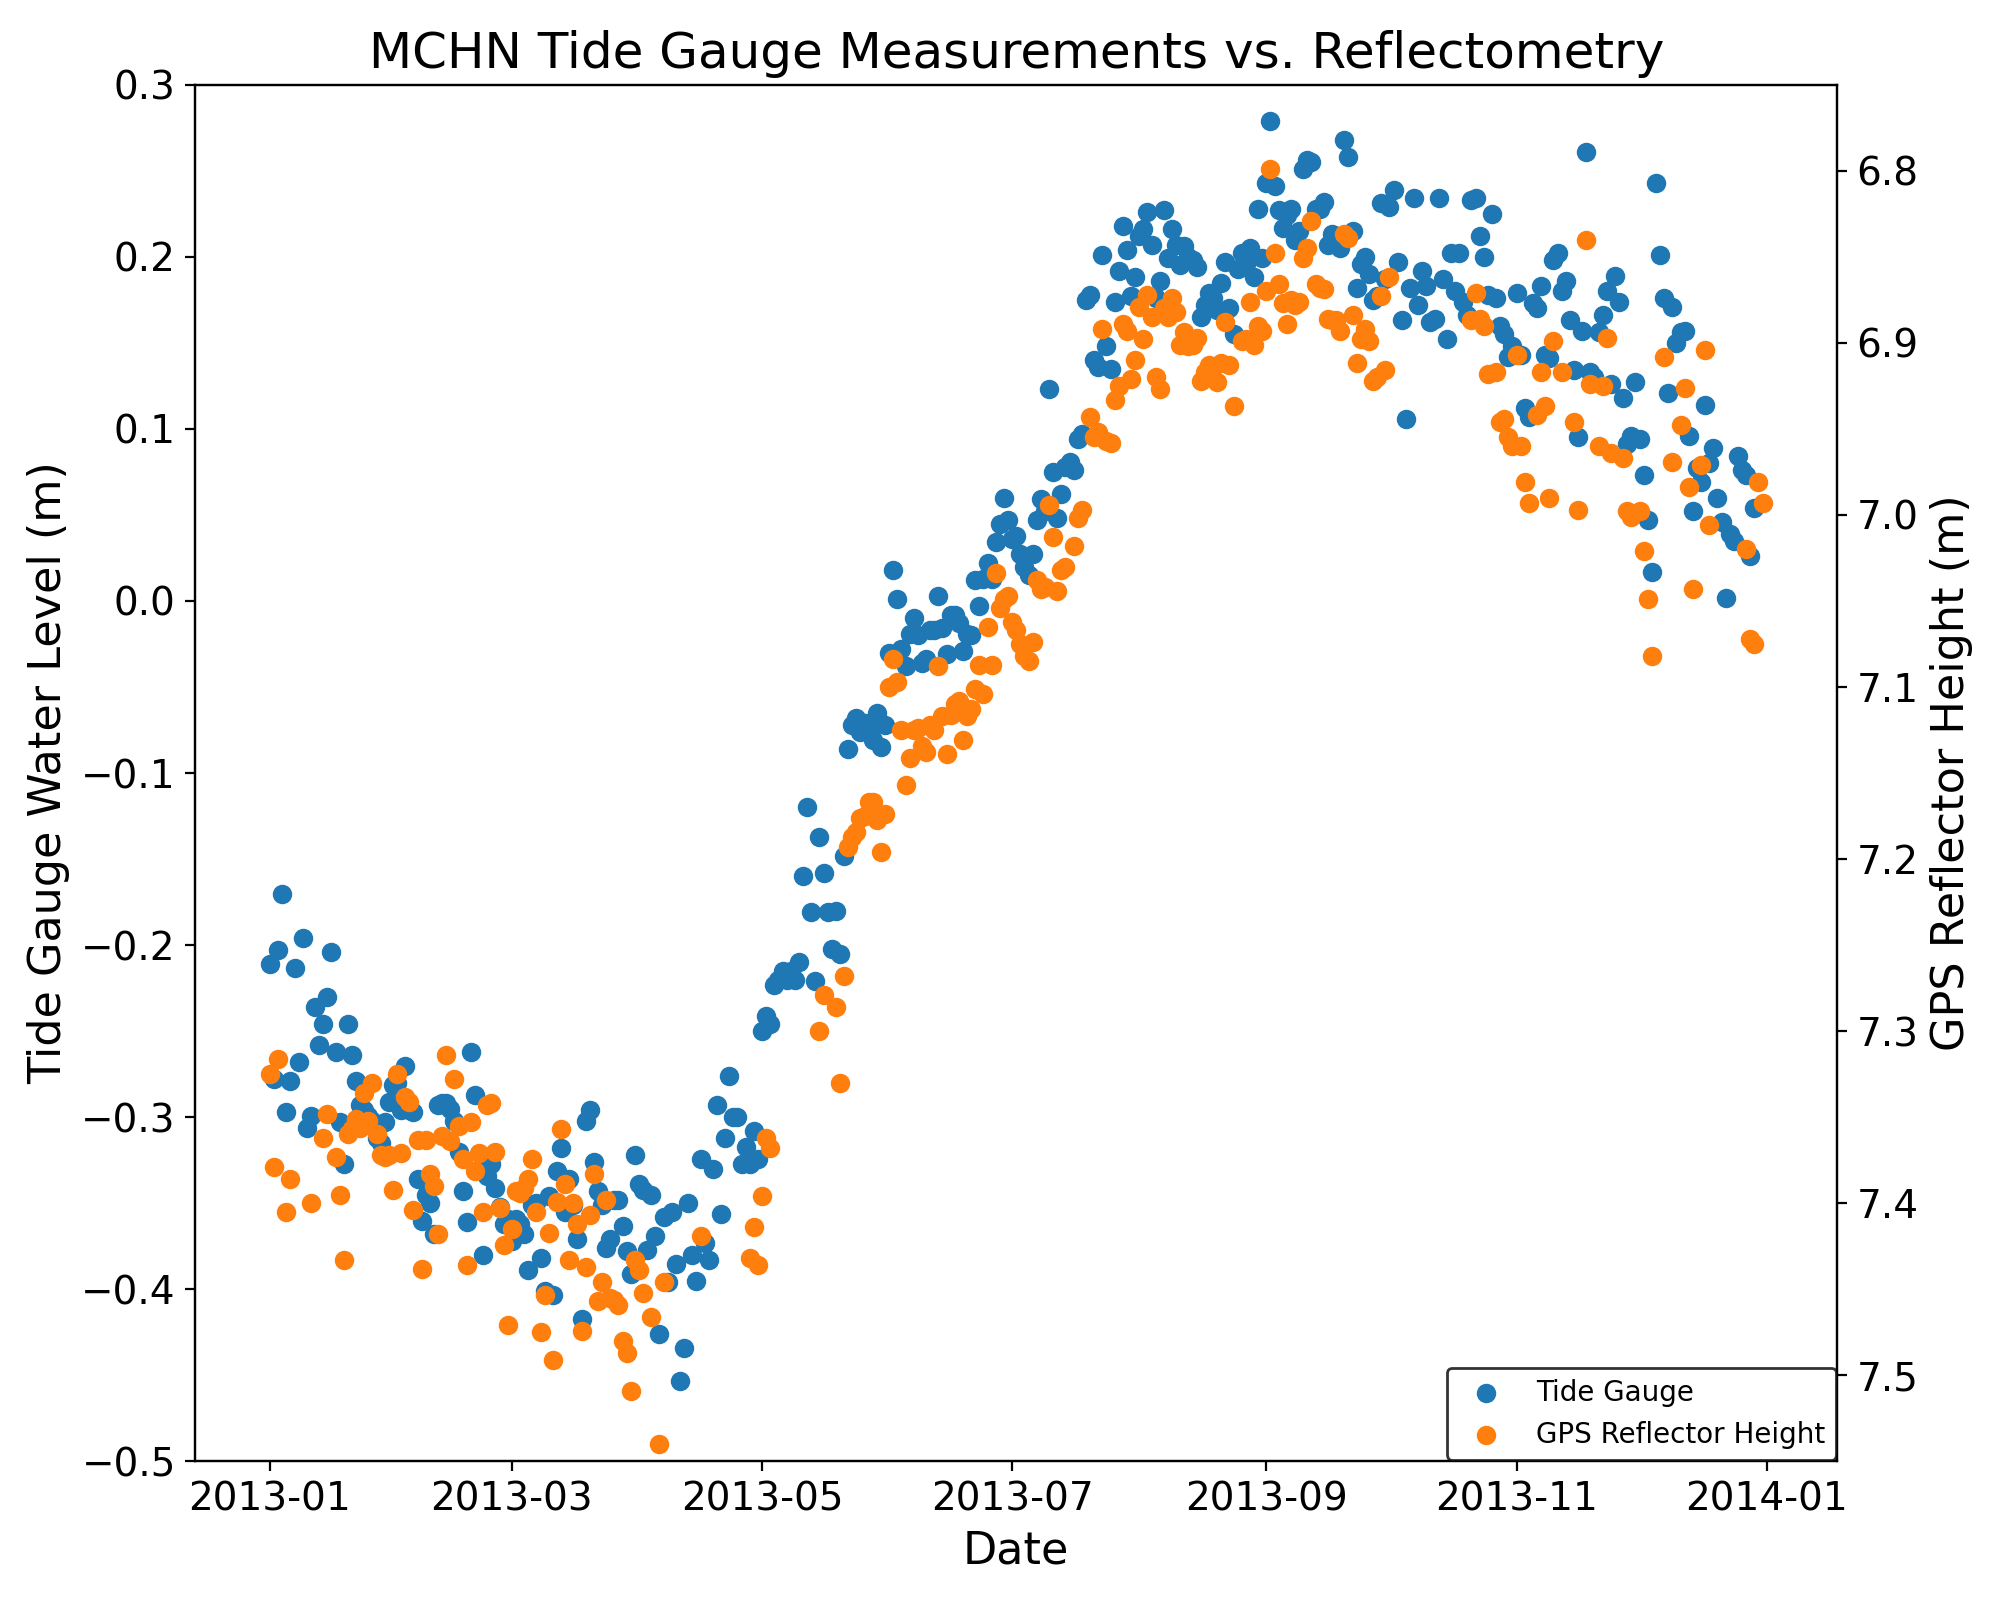
Christine Puskas did a comparison of the reflector heights and an in situ tide gauge several years ago.
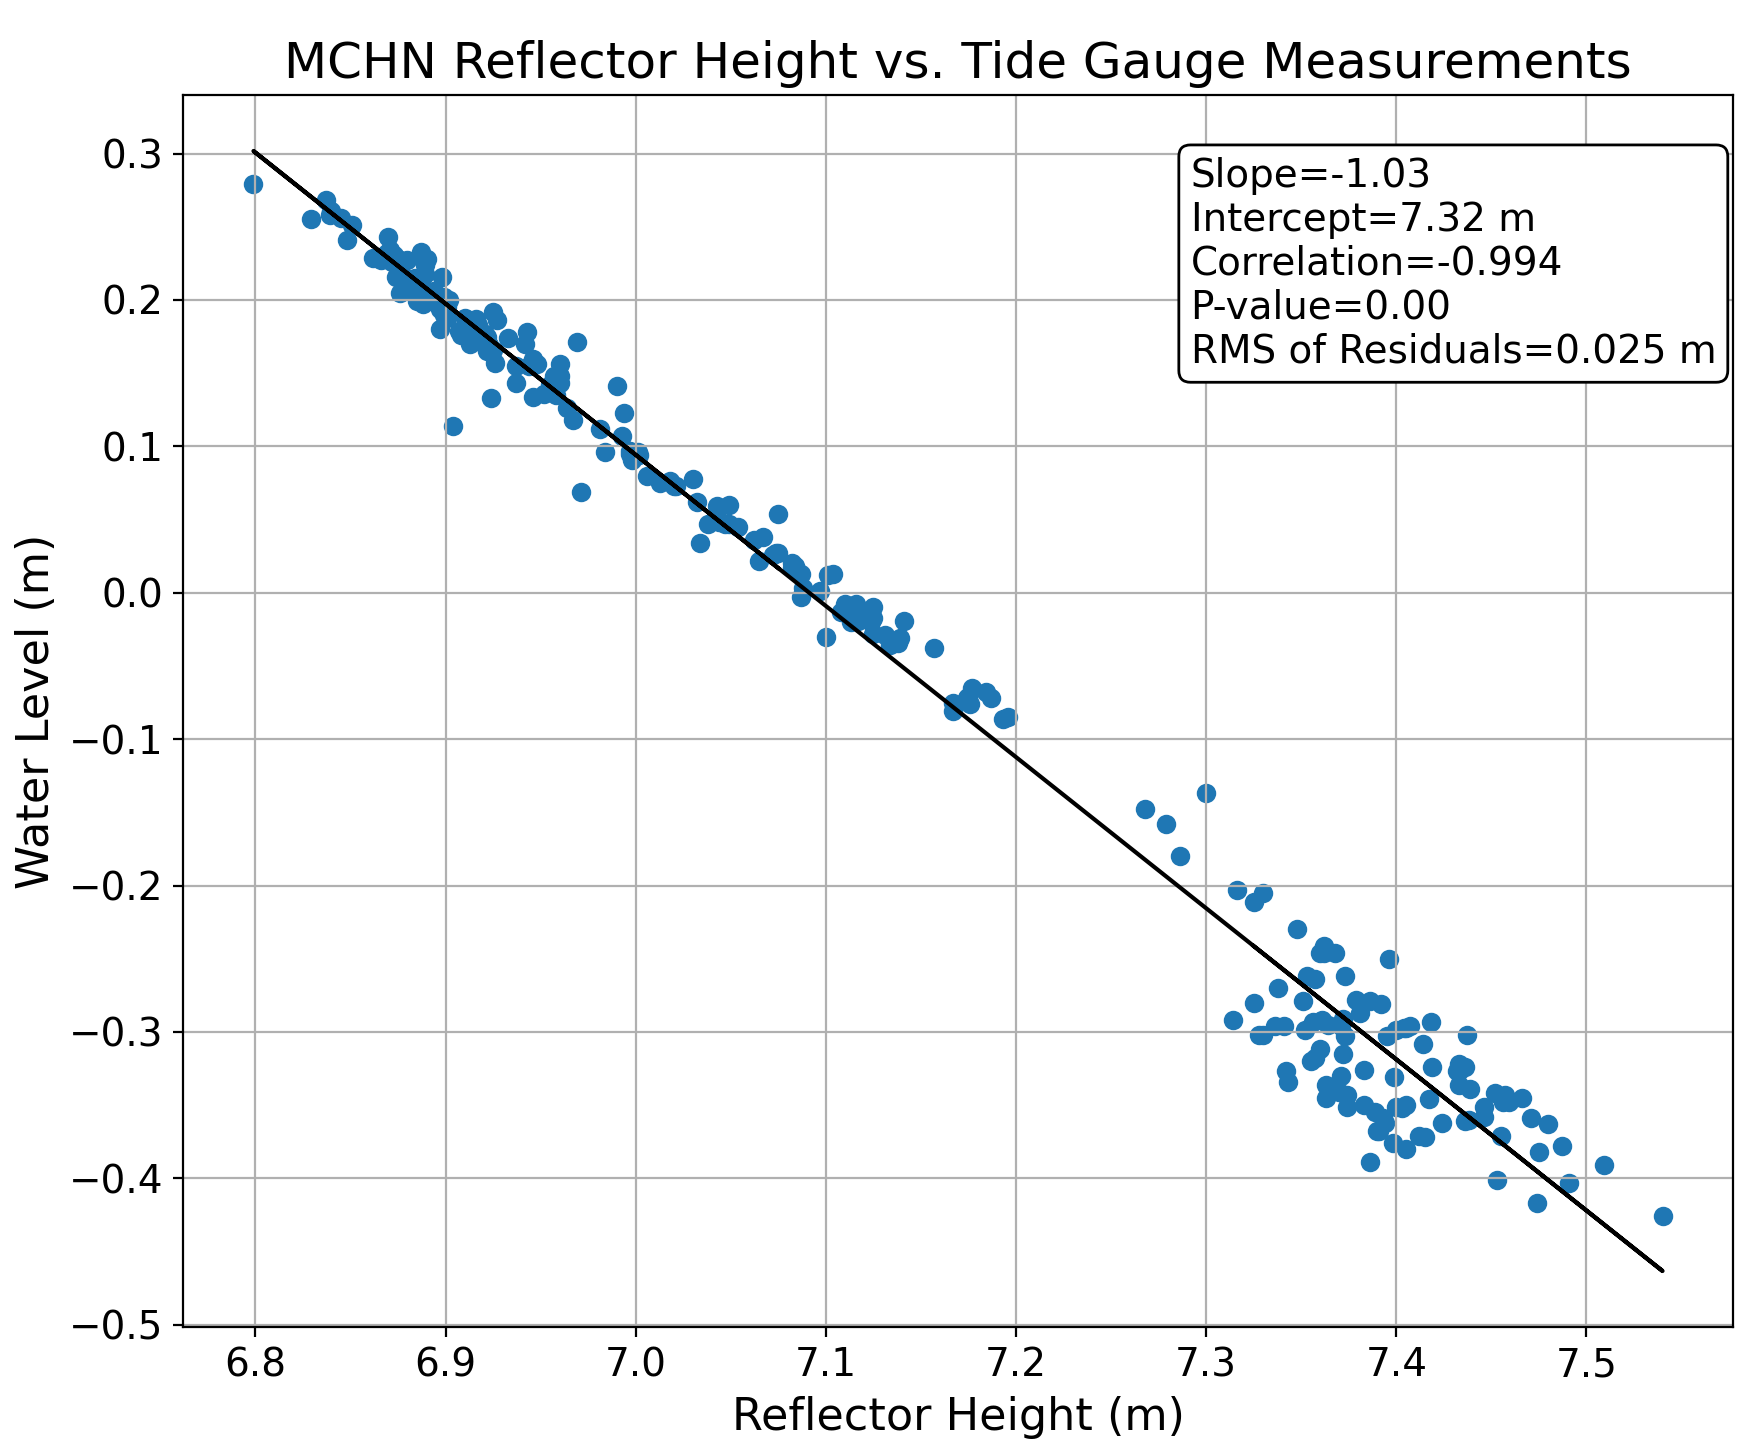
A comparison of the water levels measured by the two methods:
The linear regression between the two series gives a slope m=-1.03. The RMS of the residuals is very good, 0.025 m.
The python script used to generate these plots is provided.
Reference
DFO (2021). Institute of Ocean Sciences Data Archive. Ocean Sciences Division. Department of Fisheries and Oceans Canada. http://www.pac.dfo-mpo.gc.ca/science/oceans/data-donnees/index-eng.html. Data obtained on 2021-01-28.