Lake Yellowstone, USA
Use Case Updated December 10, 2022
metadata
Station Name: p709
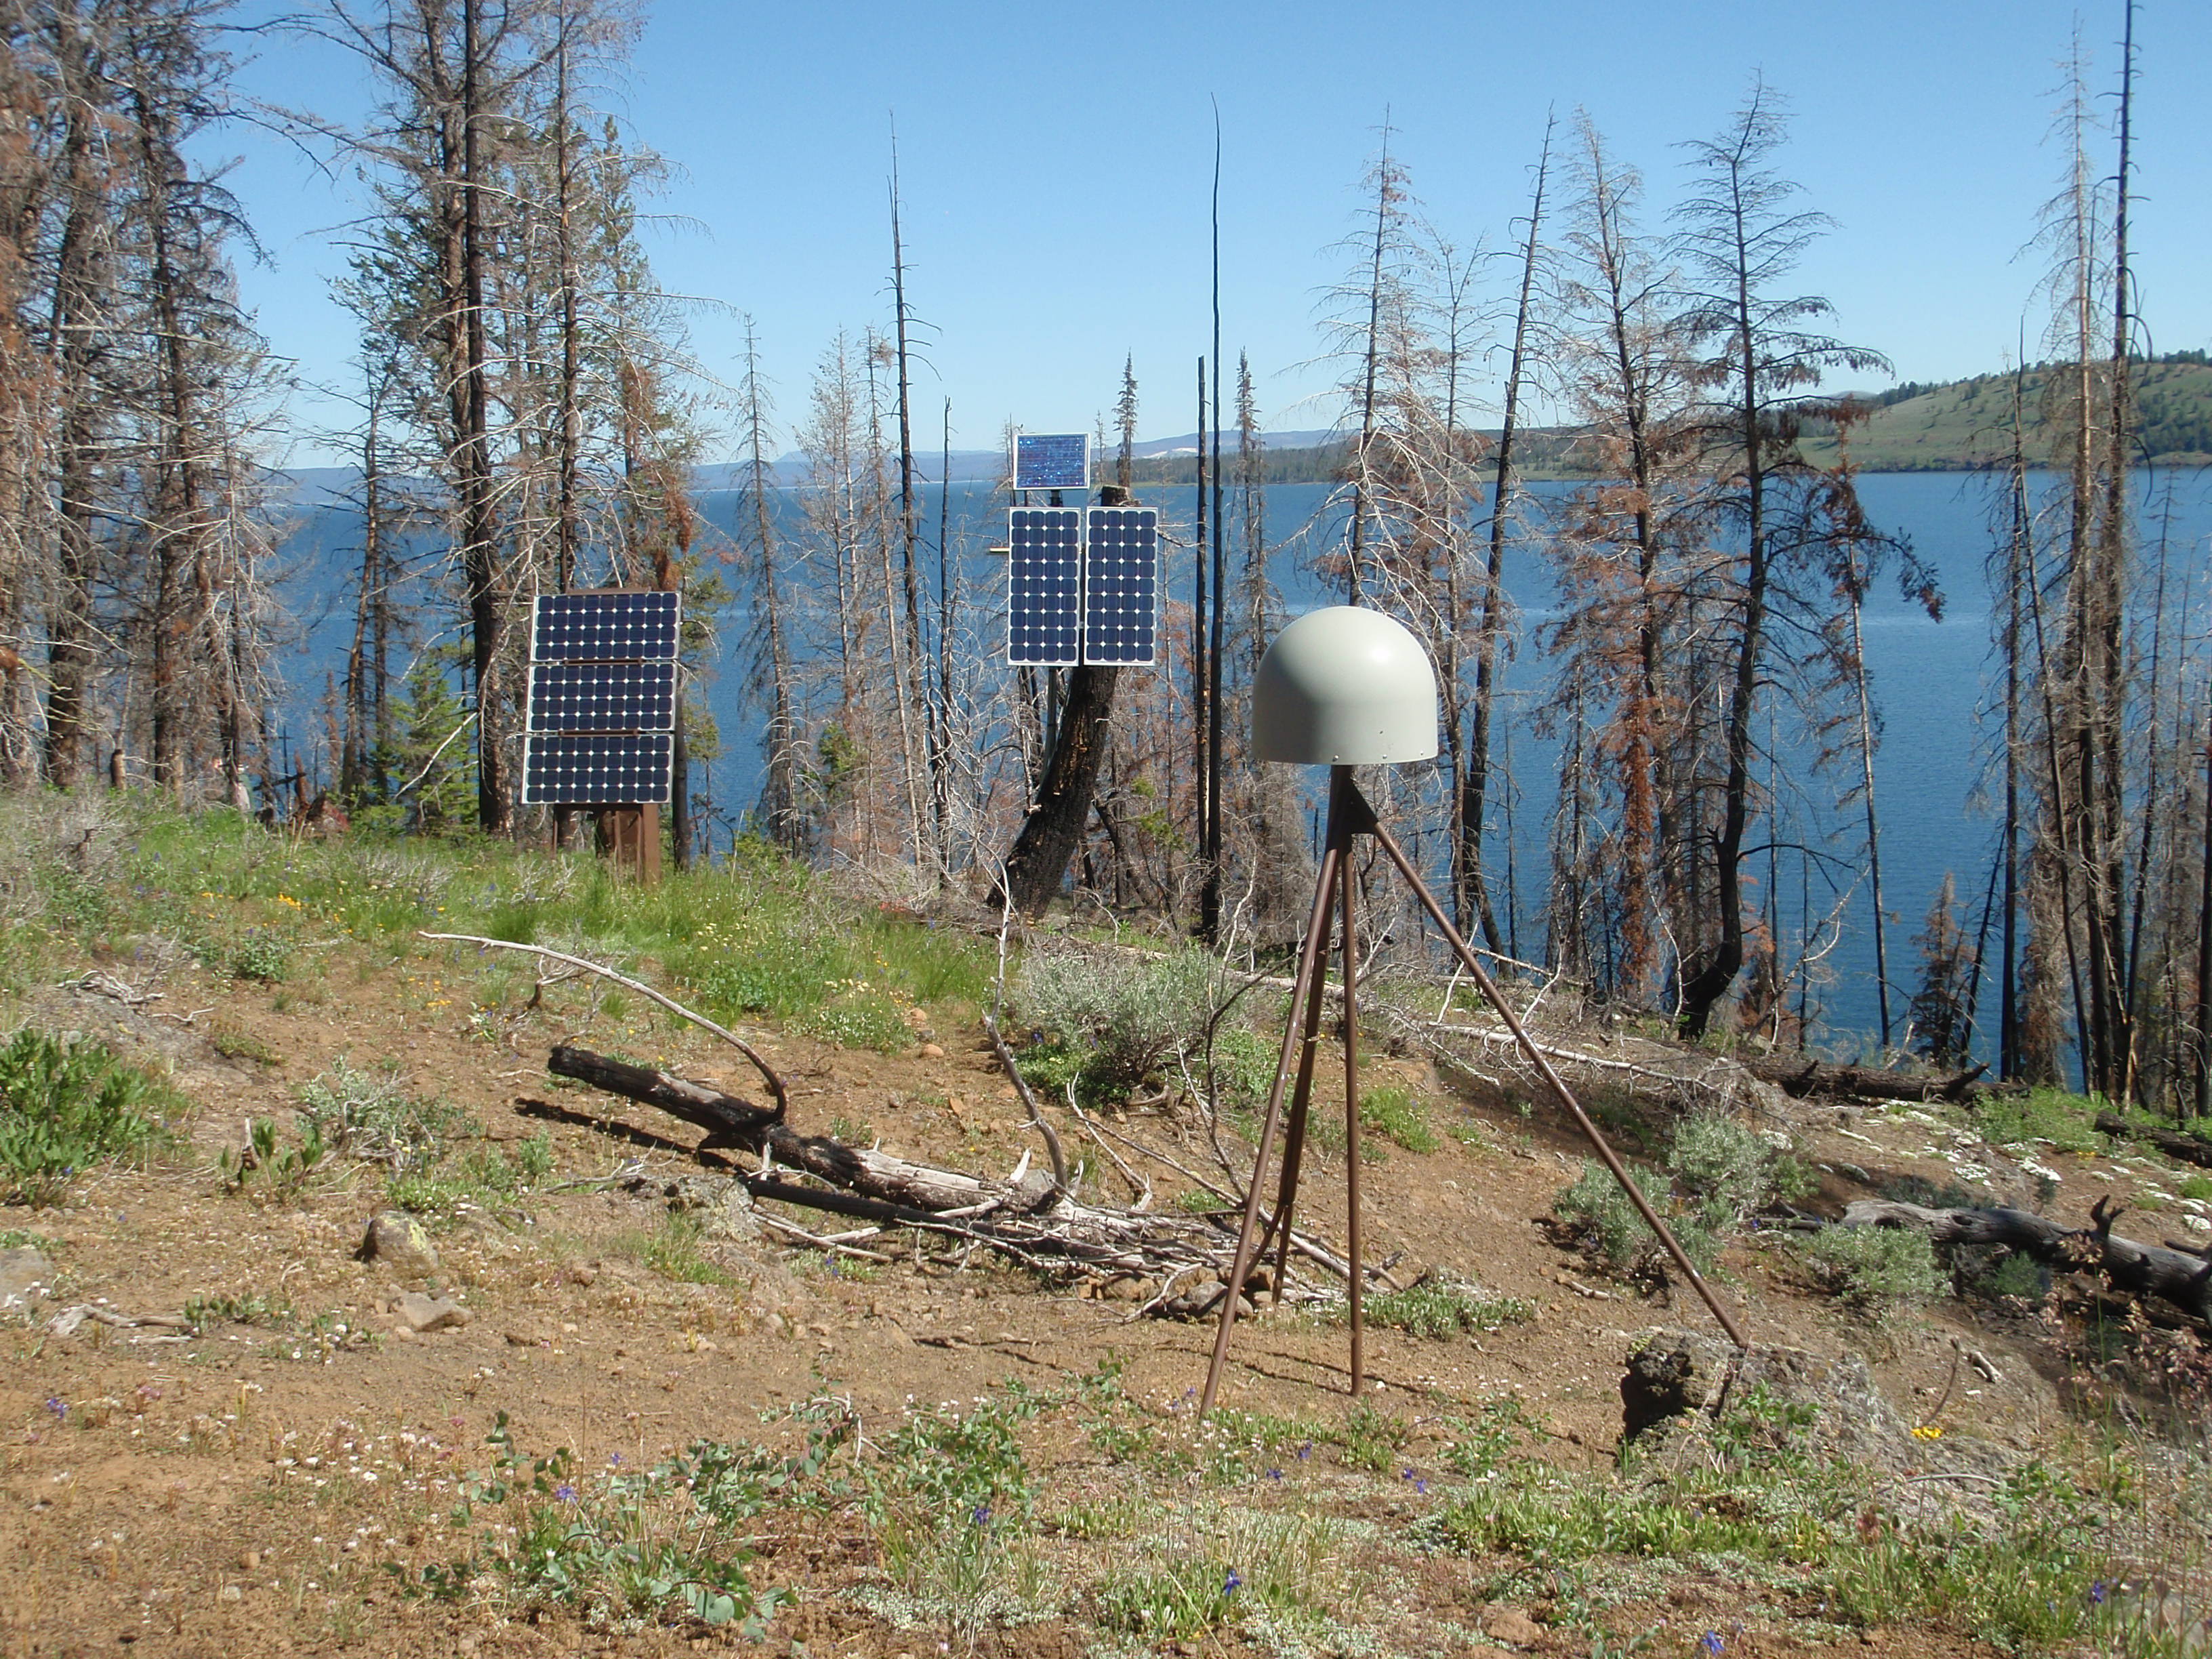
Why does this photograph suggest that GNSS-IR should not work?
Archive: unavco
Ellipsoidal Coordinates:
Latitude: 44.3917953
Longitude: -110.286006
Height: 2379.7 m
Examine the Site
Note that I have restricted azimuths here and used a reflector height of 30 meters.
Background Information
This site was installed for tectonic purposes. The view of the lake from P709 is severely obstructed and it is relatively far from the shore. However, if you have access to the highrate (1-Hz) datastream and use low elevation data, you can easily detect the daily average lake level. Make sure that you use the reflection zone information when you make your json file.
Translate Data
rinex2snr p709 2022 1 -dec 5 -archive unavco -rate high -orb gnss
quickLook
quickLook p709 2022 1 -e1 5 -e2 10 -h1 20 -h2 40
Estimate Reflector Height
Set your analysis strategy using the gnssir_input.
rinex2snr p709 2021 183 -dec 5 -archive unavco -rate high -orb gnss
gnssir p709 2021 1 -doy_end 180
Use daily_avg to calculate a daily reflector height. Various statistics also
come to the screen. Here is the RH series:
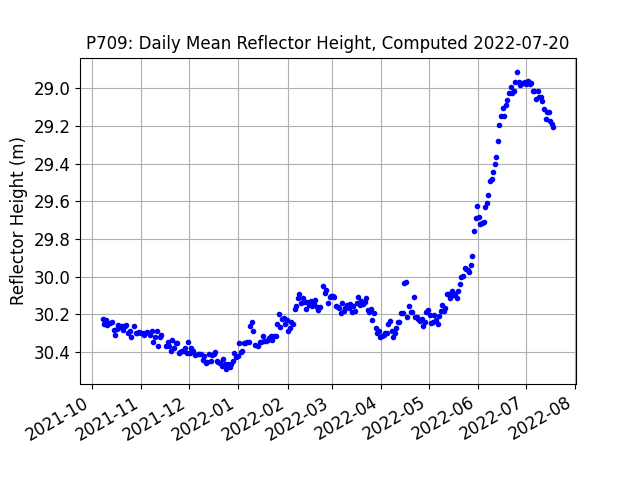
I am only showing the data for the new multi-GNSS receiver. If you look at earlier data, you are restricted to L1.
In Situ Data
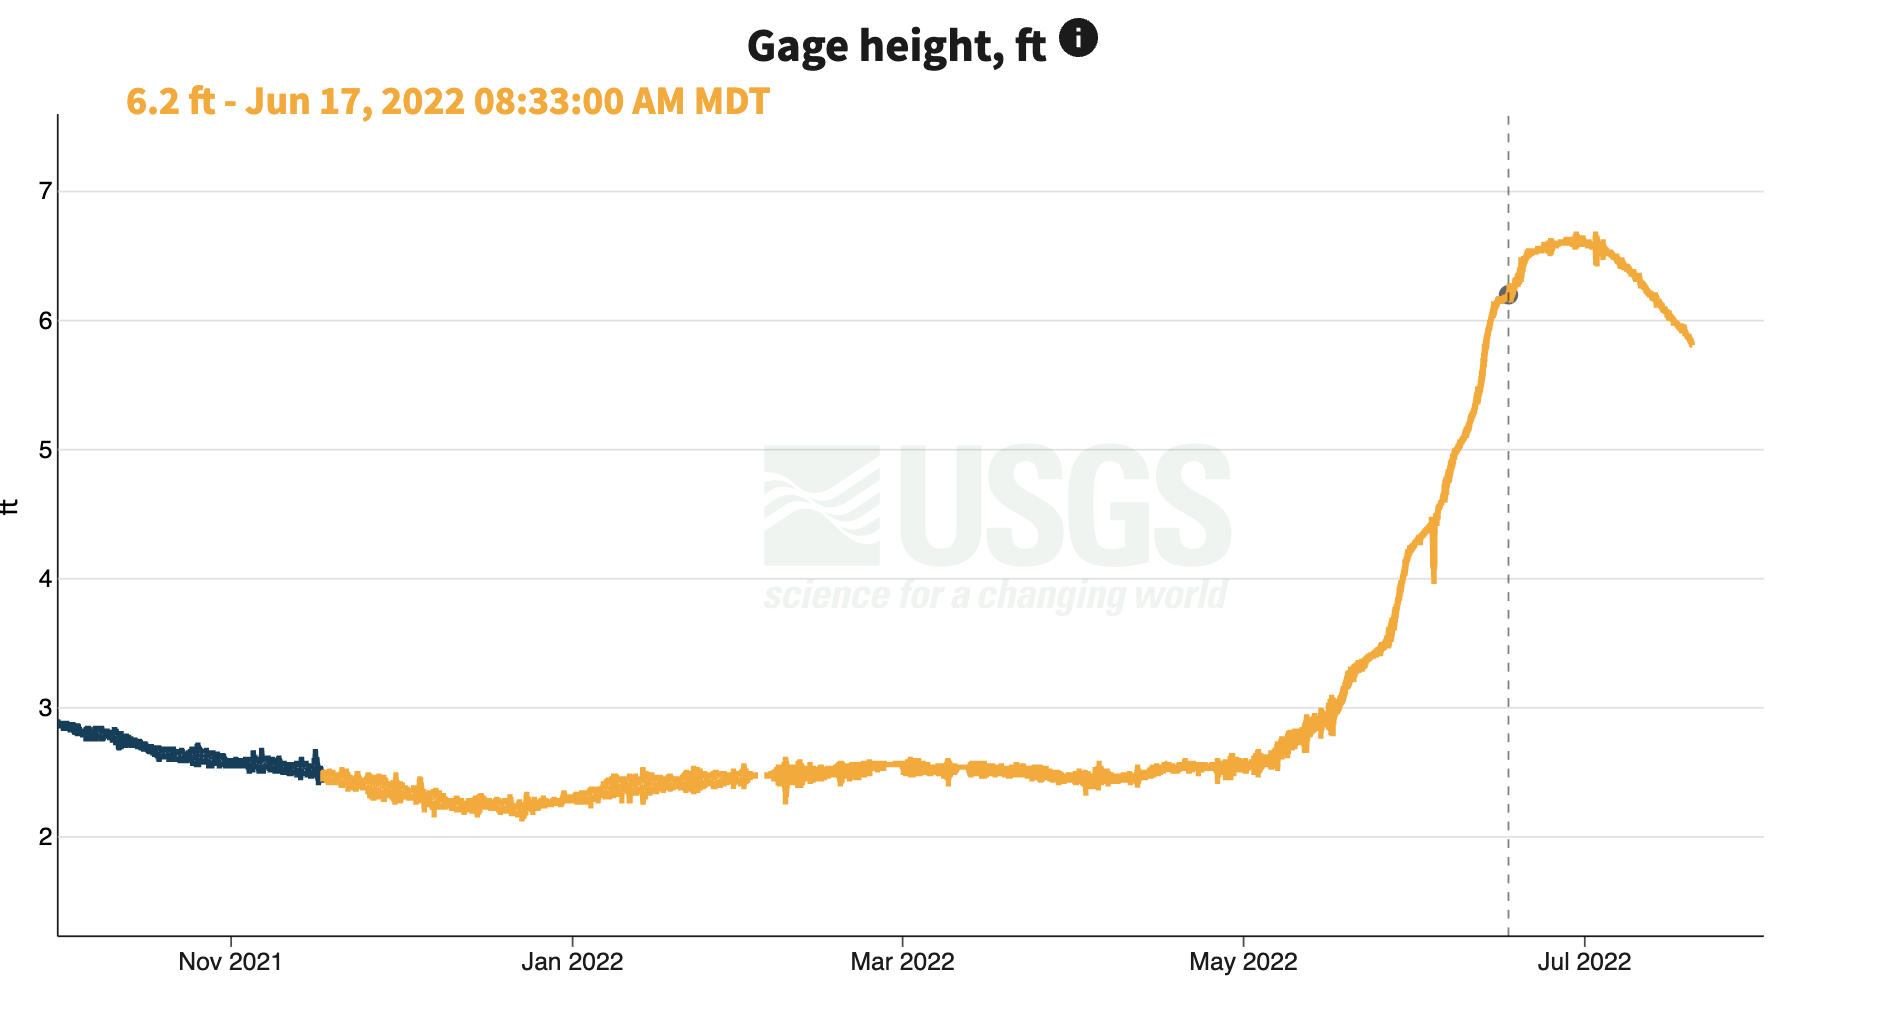
Living in the US - you get to see feet instead of meters!
Something to Think About
Note that the amplitudes (of the RH periodograms) are also a bit interesting.
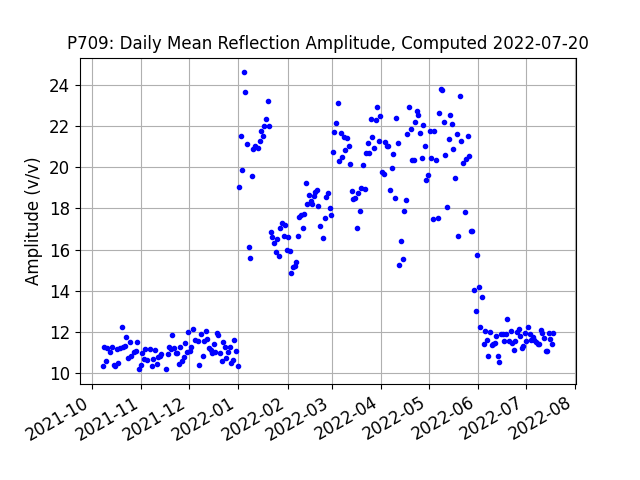
Why do you think the amplitudes vary like this? What changes about Lake Yellowstone in the winter?