St Lawrence River
To the best of our knowledge, access to the current high-rate data streams needed to do reflectometry at this site is no longer allowed. Please contact NRCAN for further information.
The data used in the test case described below are still available. Originally we used teqc to merge the hourly files required, but this code is no longer supported by UNAVCO. We have replaced it with gfzrnx which is supported by GFZ.

metadata
Station Name: pmtl
Location: Port de Montreal, Montreal, Canada
Archive: NRCAN
Ellipsoidal Coordinates:
Latitude: 45.557
Longitude: -73.520
Height: 54.073 m
Station Page at Natural Resources Canada
Station Page at Nevada Geodetic Laboratory
Data Summary
Station PMTL is located on the Viterra Montreal Terminal building on the St Lawrence River in Montreal, Canada. It is operated by the Montreal Port Authority.
GPS L1 and Glonass L1 and L2 can be used for this site. Since the site is more than 60 meters above the water, you need to use high-rate GNSS data.
Note the ellipsoidal height and geoid corrected height. To pick an azimuth and elevation mask, try the reflection zone webapp with station name pmtl, varying elevation angles, and different azimuth limits. Here is one effort:

quickLook
Make a SNR file for multi-GNSS and high-rate:
rinex2snr pmtl 2020 330 -archive nrcan -rate high -orb gnss
quickLook pmtl 2020 330 -h1 40 -h2 90 -e1 5 -e2 12
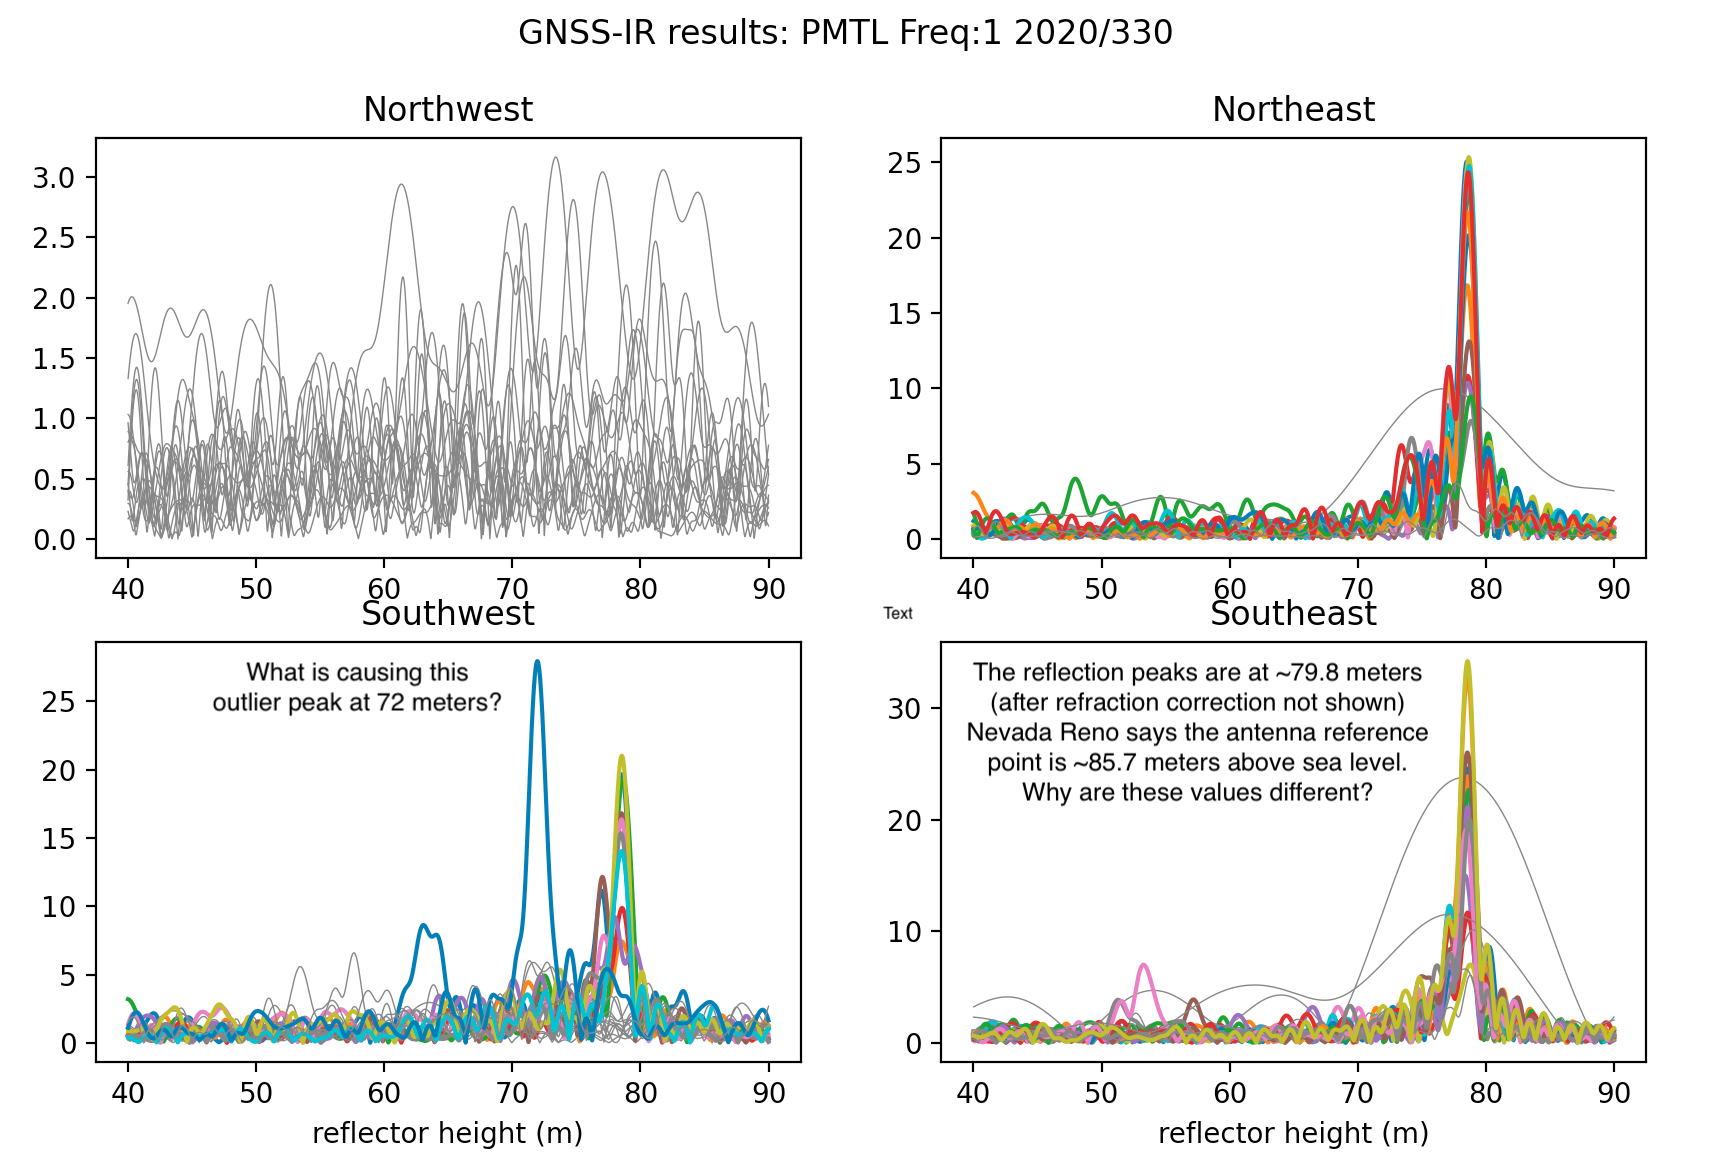
I have annotated this quickLook periodogram to point out that there is an outlier in the SW region.
You can also see that the NW region is useless, which is what we should expect.
Windowing down the reflector region and using day of year 270:
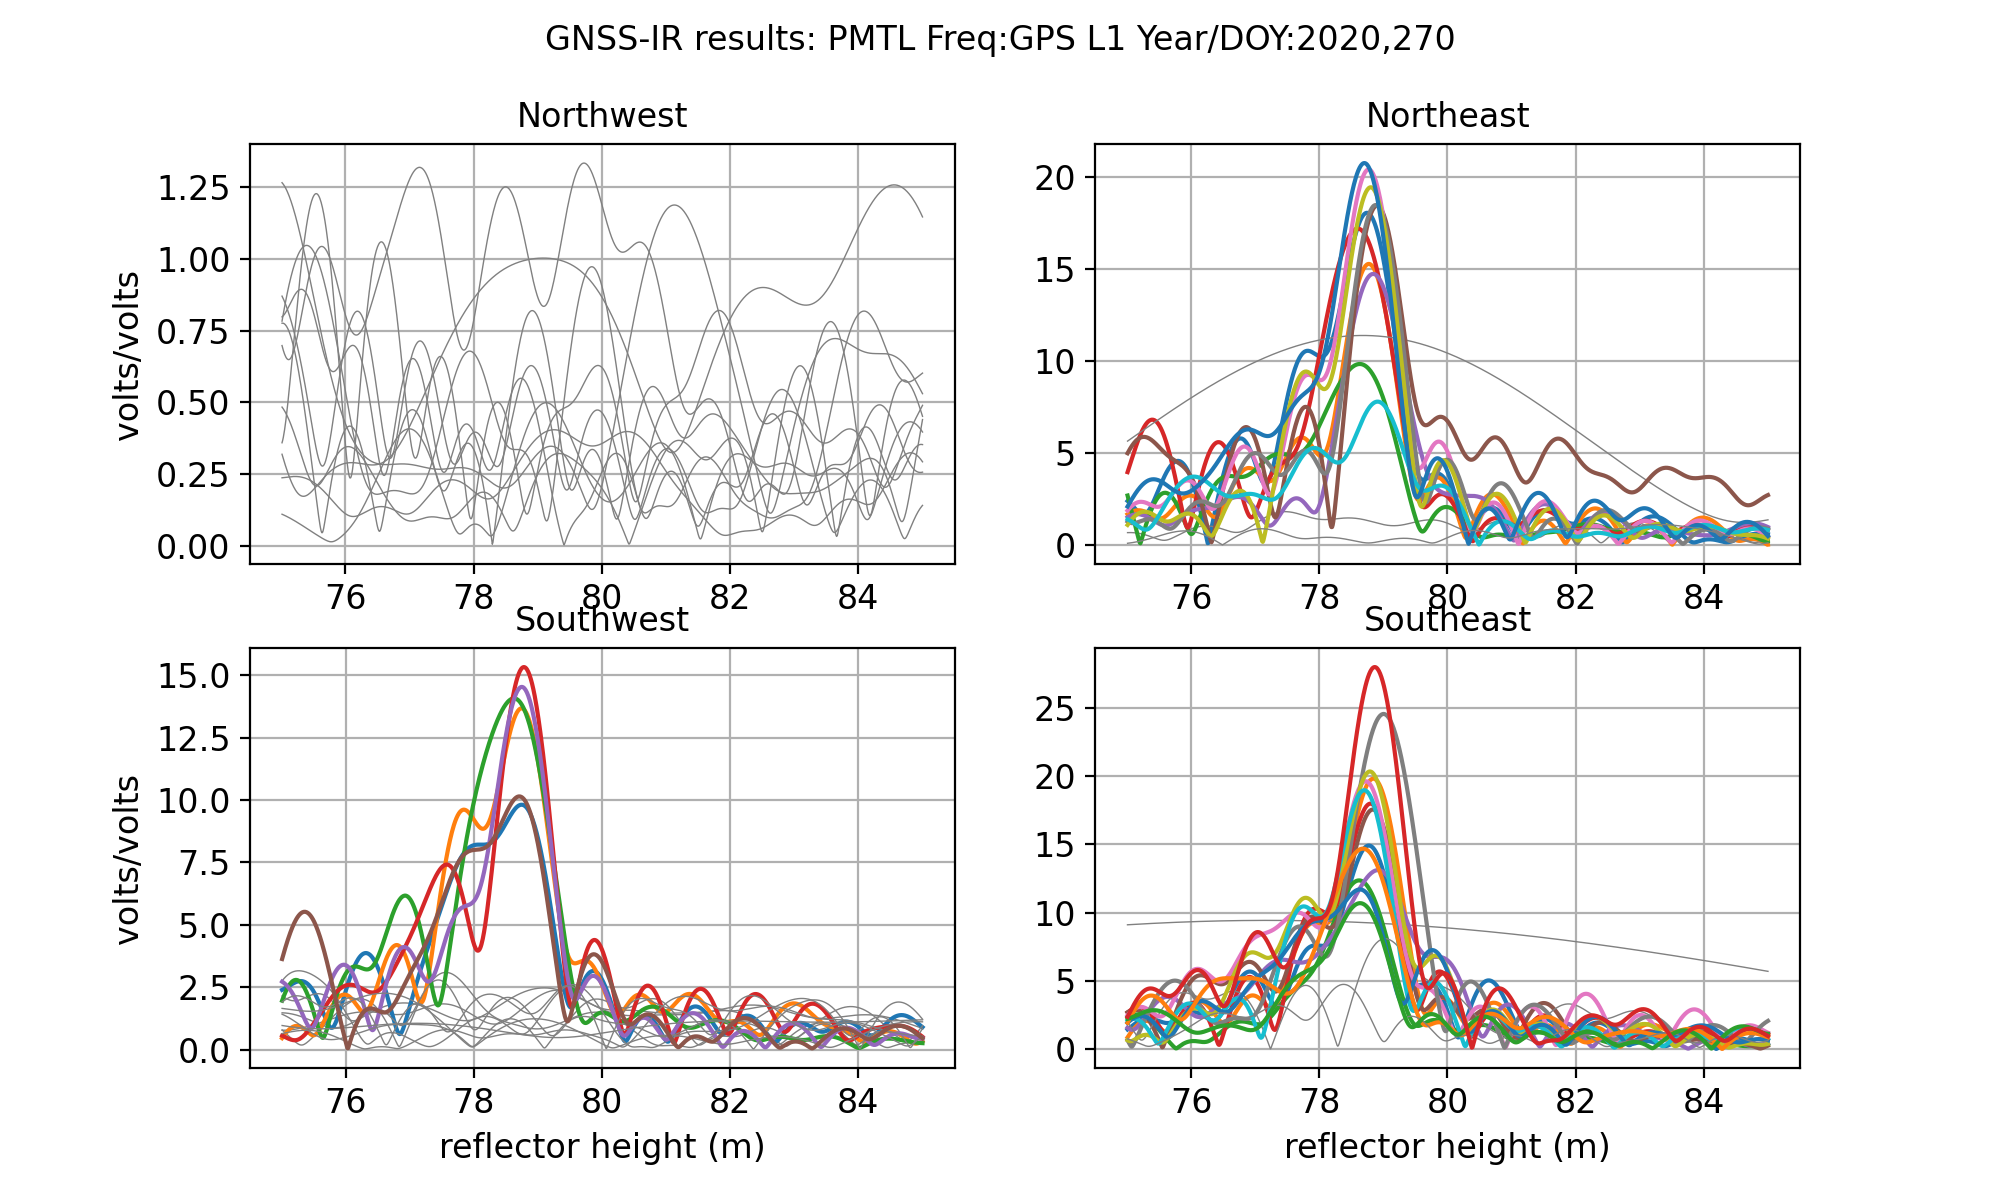
The QC plot gives the azimuth windows - and help on setting the required amplitude and peak to noise ratio.
Retrievals are not returned near 90 degrees because of the satellite inclination and the way the
azimuth regions are defined in quickLook. It does not mean there are obstructions in that direction.

Analyze the Data
Set up analysis instructions, using only GPS L1, and Glonass.
gnssir_input pmtl -h1 75 -h2 85 -e1 5 -e2 12 -peak2noise 3 -ampl 7 -frlist 1 101 102 -azlist2 45 205
Make the SNR files (this takes a long long time):
rinex2snr pmtl 2020 270 -doy_end 300 -archive nrcan -rate high -orb gnss
This is also slow - though not as slow as translating RINEX files and computing orbits:
gnssir pmtl 2020 270 -doy_end 300
One way to make the gnssir code run faster would be to loosen up the RH precision. Since you are using daily averages, it is not necessary to use the default of 5 mm. 10 mm would suffice. This needs to be hand-edited in the json file.
Now compute daily averages:
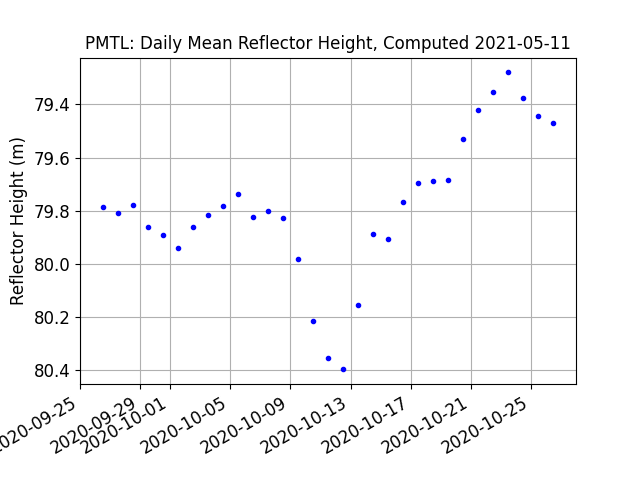
daily_avg pmtl 0.25 50 -txtfile pmtl-rh.txt
All tracks:
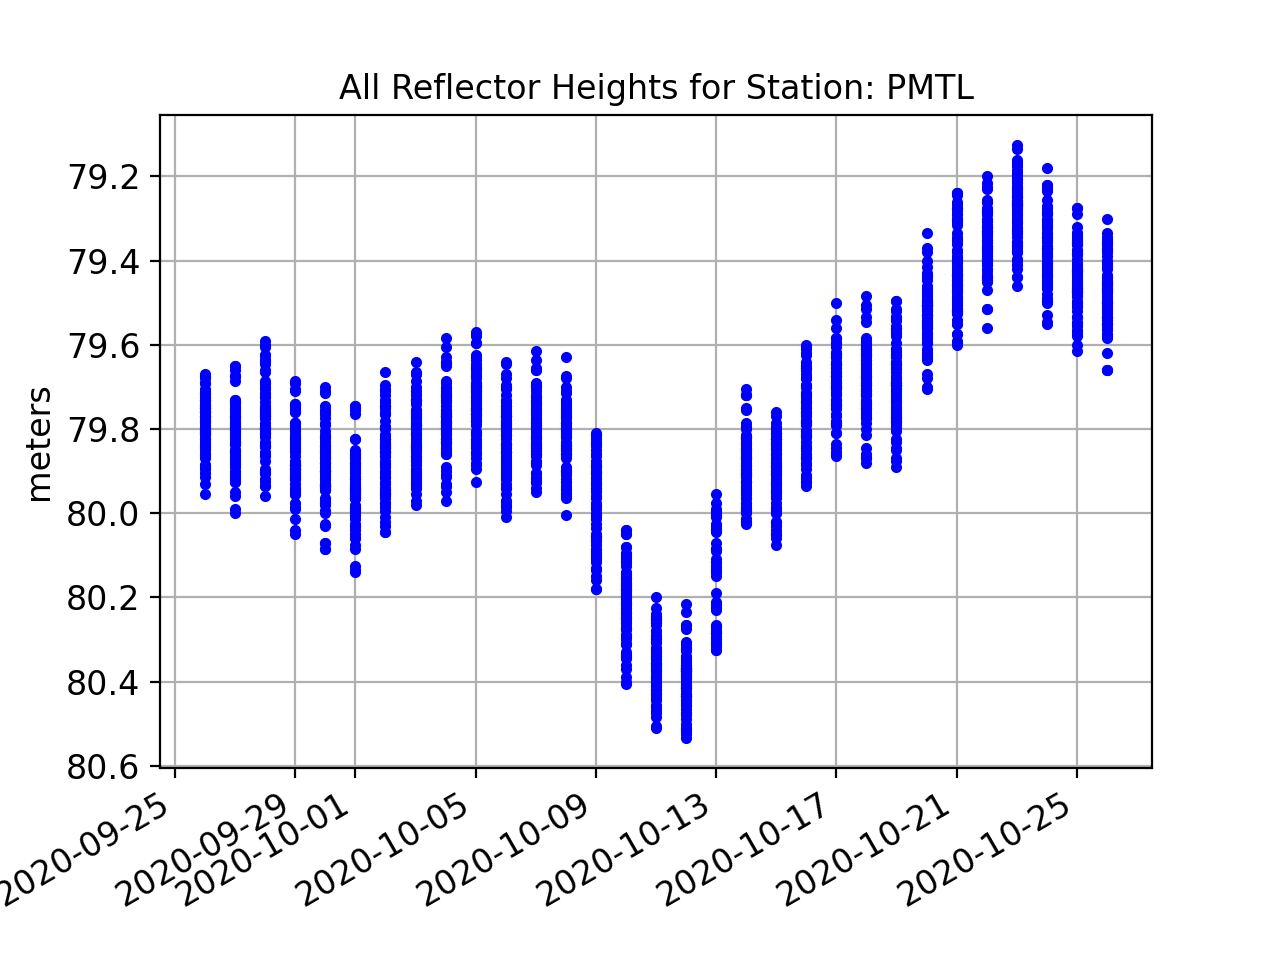
The daily average:
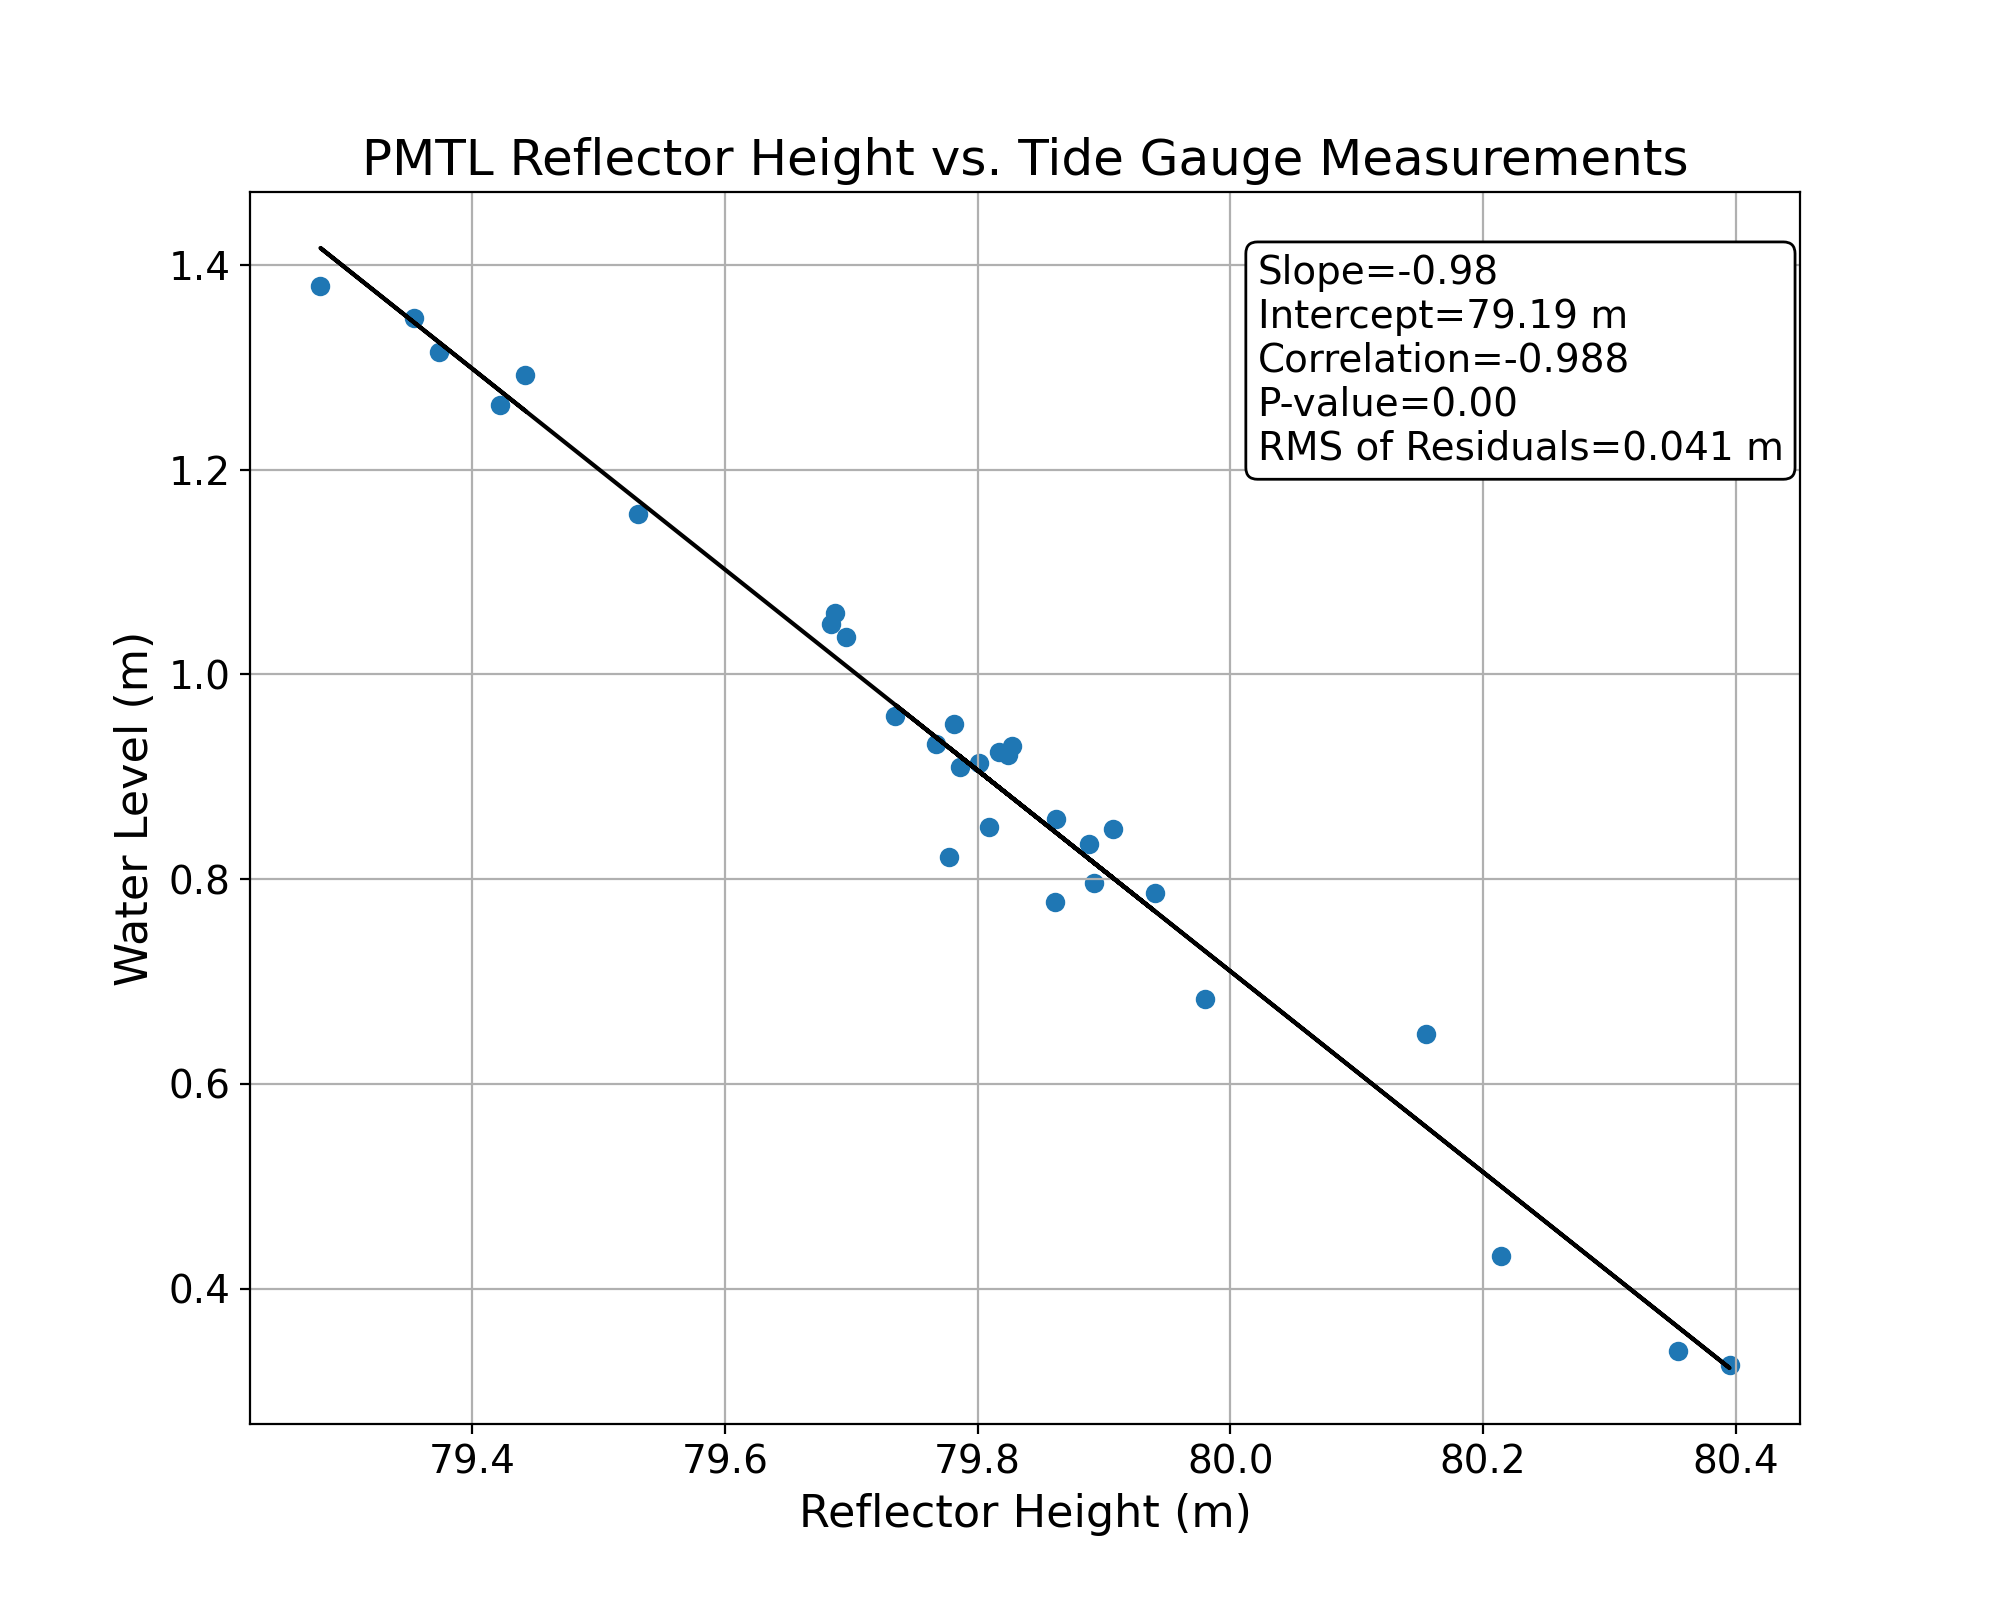
Accuracy
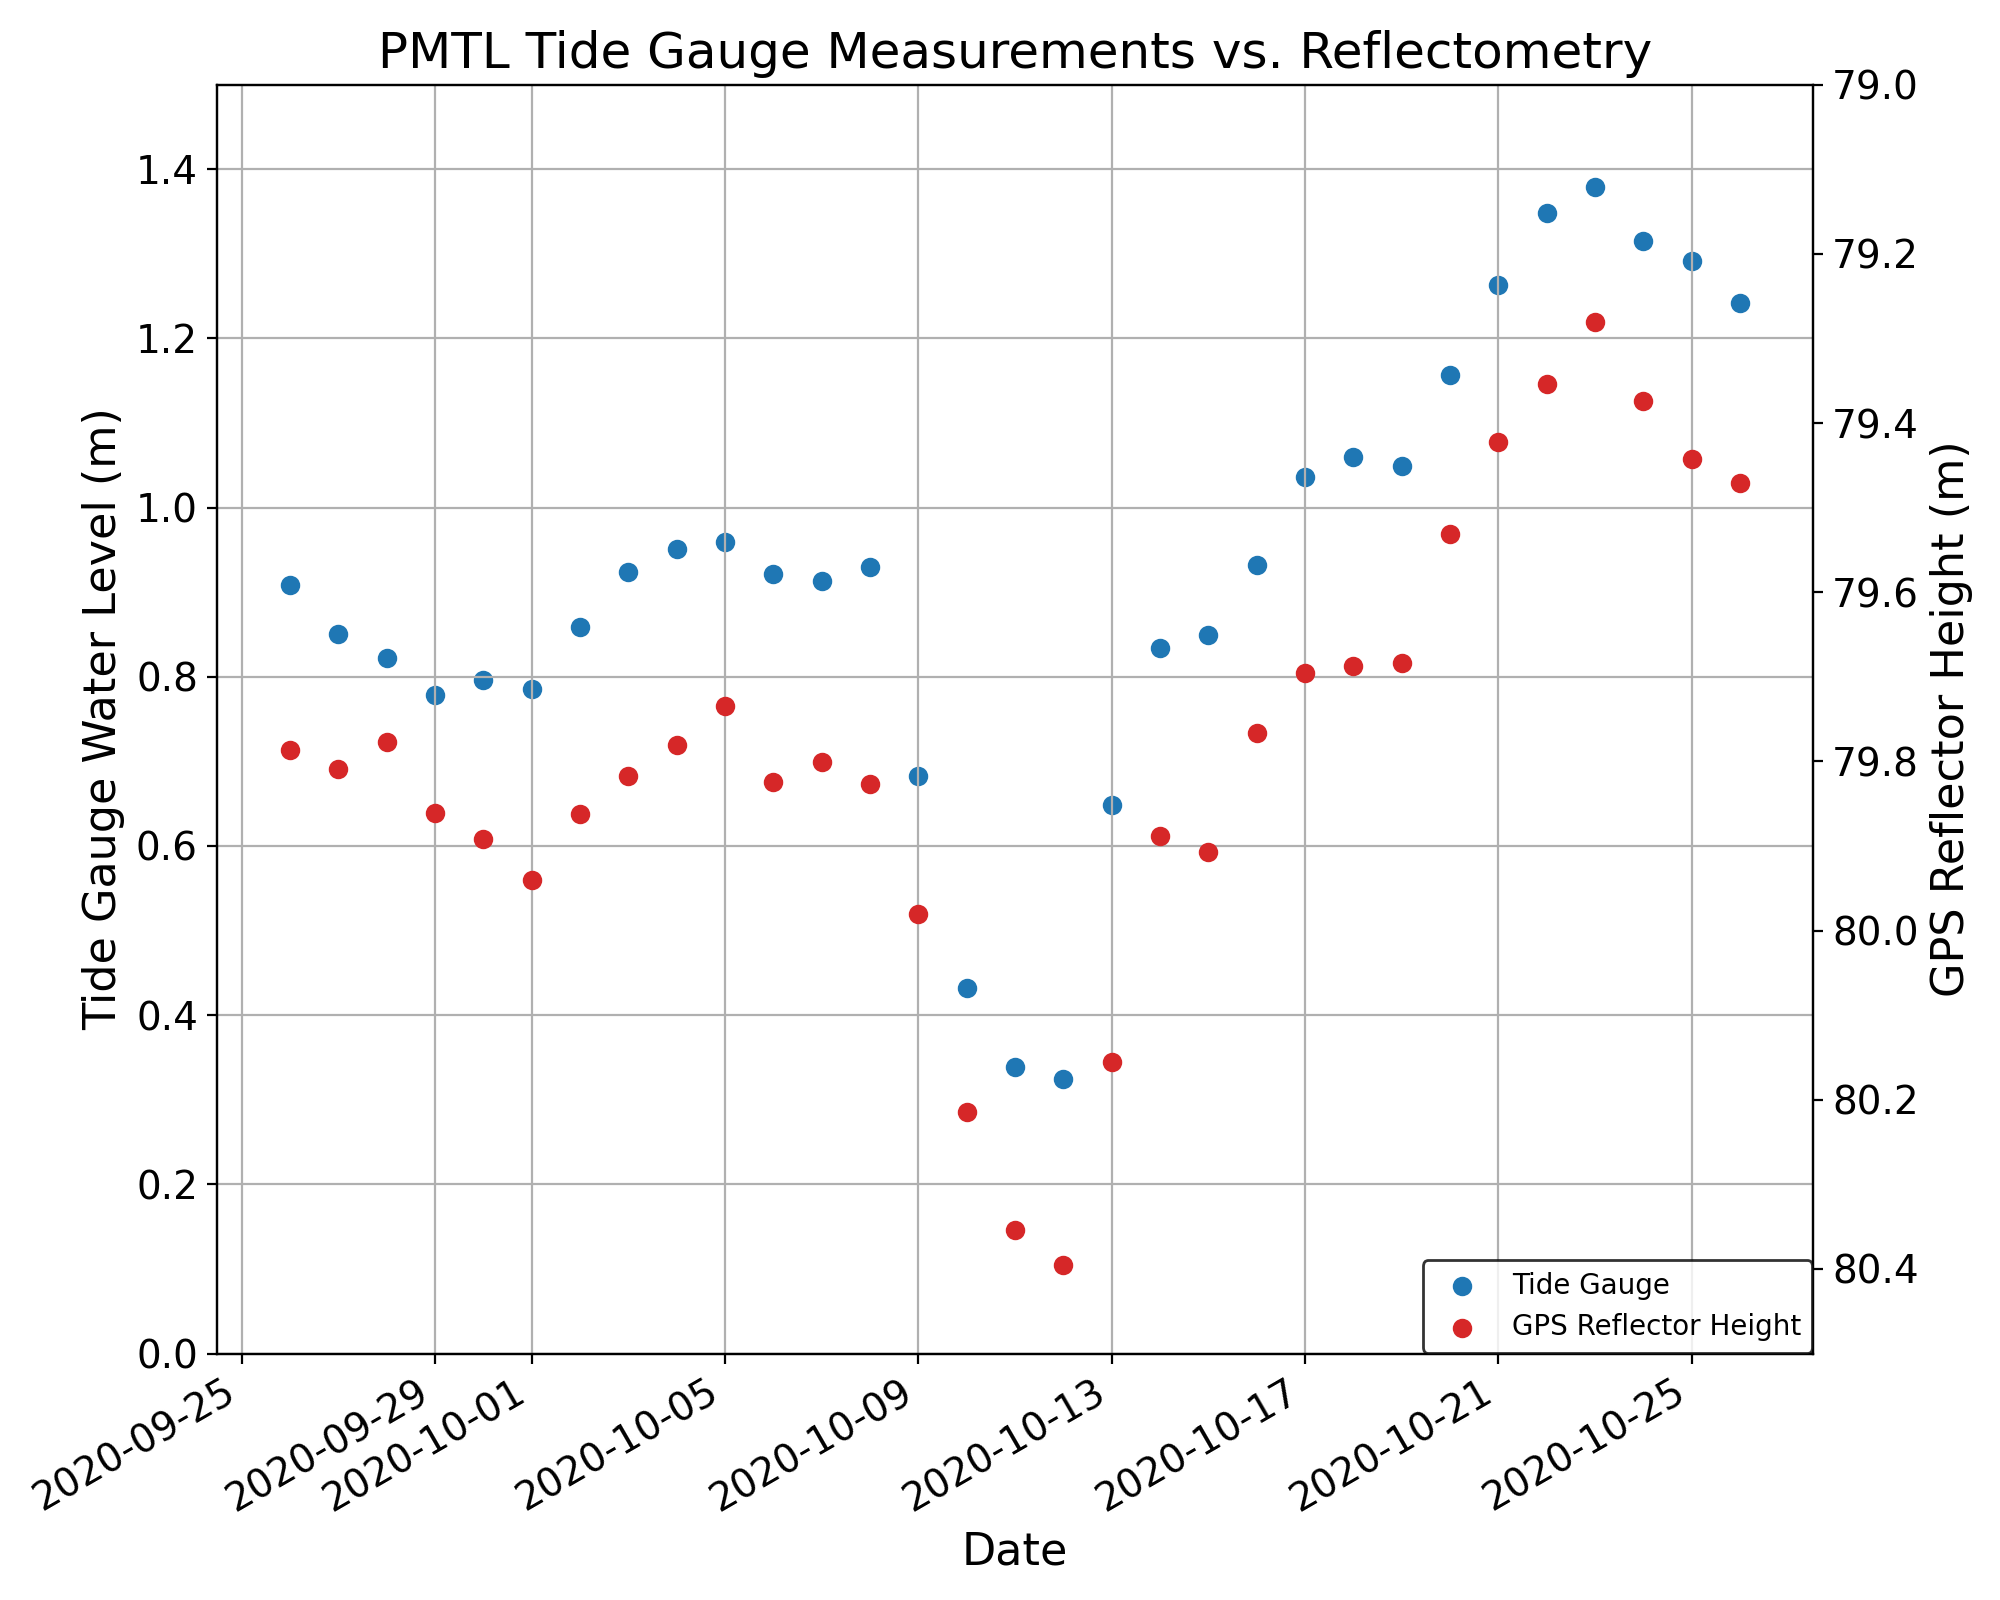
The Canadian Hydrographic Service within Fisheries and Ocean Canada operates tide gauges along the St Lawrence River, the closest of which is Montreal Jetee #1 (station 15520), about 1 km south of the GNSS site. Tide data can be downloaded. Use the daily mean water level and UTC when submitting a request and download the resulting csv file.
For this use case, the tidal data have already been downloaded. Given that there is quite drastic water level changes within a day, it is entirely plausible that the correlation will improve if using the subdaily RH and hourly tide gauge data.