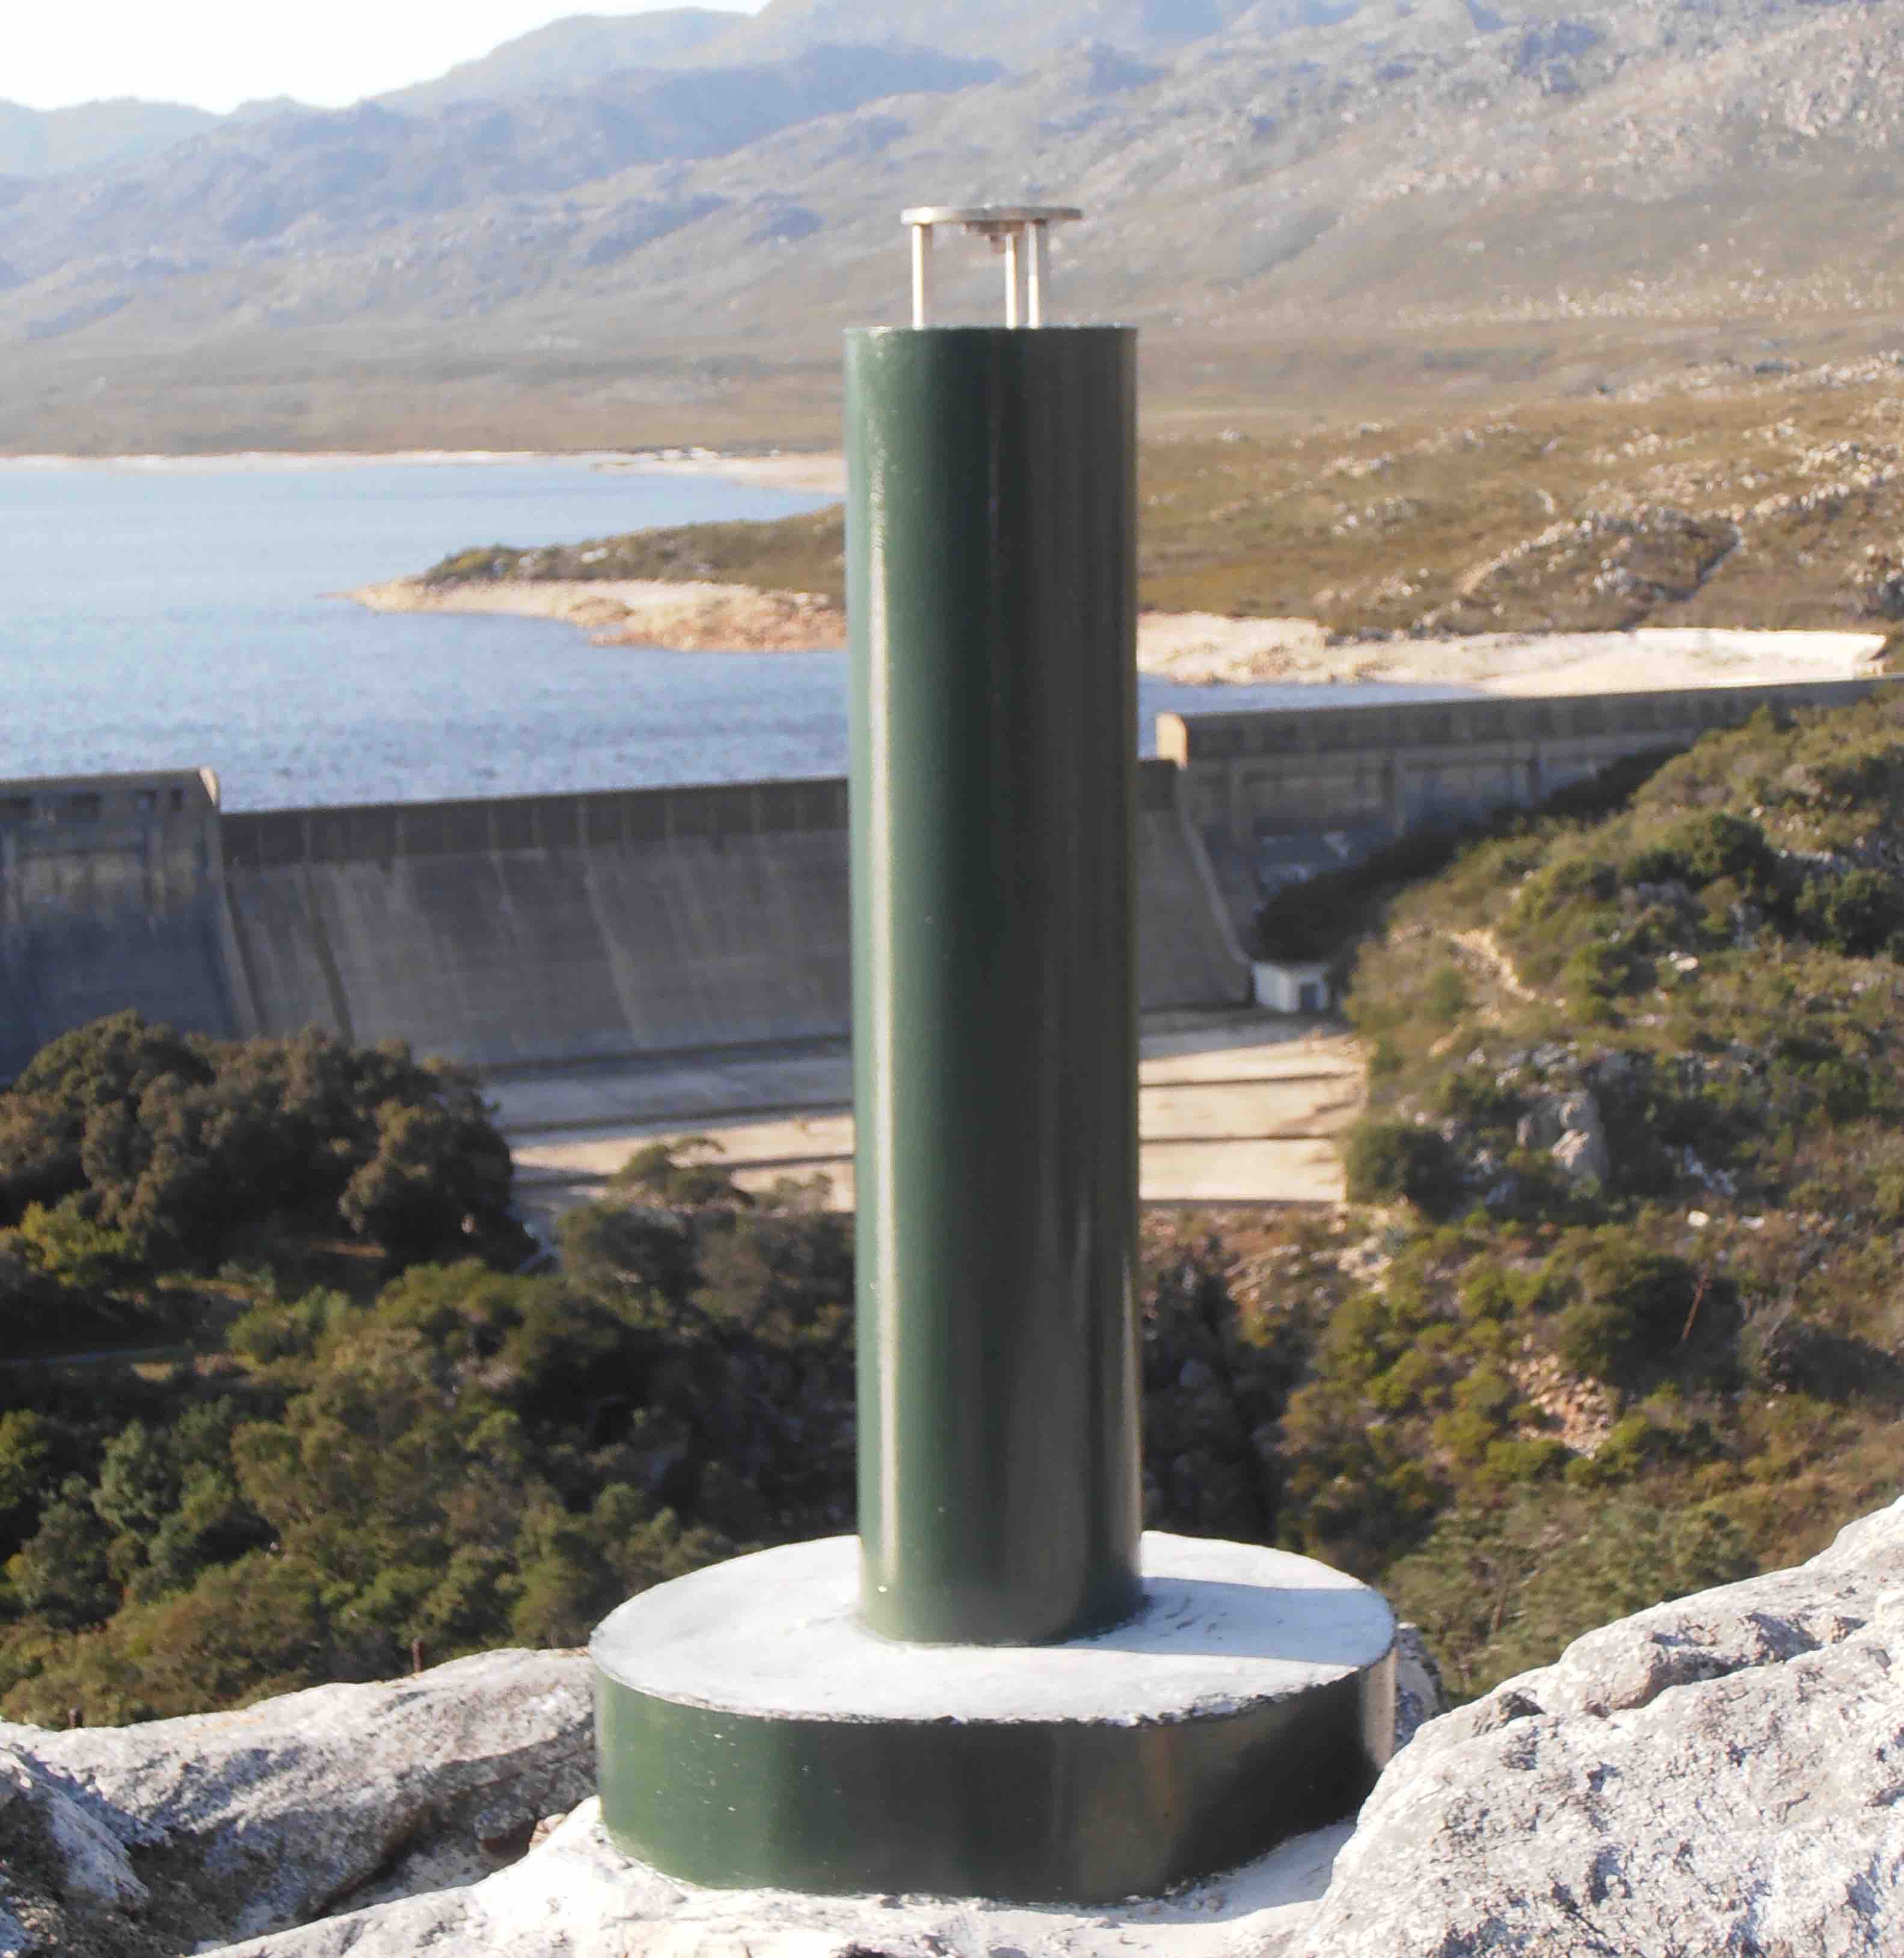
Steenbras Dam, South Africa
metadata
Station Name: sbas
Latitude: -34.18704704
Longitude: 18.84986166
Ellipsoidal Height(m): 403.342
Network: TRIGNET
Archive: UNAVCO (use the special option)
The data used here have been kindly provided by TRIGNET so that we could access L1 and L2C signals at 15 second sampling. This sampling rate is needed to be able to see the reservoir. However, they are in a proprietary Trimble binary format. It is non-trivial to convert those to RINEX, so in this example we will rely on files translated and archived by UNAVCO for this use case example. They can be used by specifying the “special” archive. Here we will only discuss GPS - I would encourage you to also look at the Glonass data.
Reflection Zones
Use the reflection zone web app to think about which azimuths and elevation angles to use. Note the photograph! You are not 6 meters (vertically) above the water. You will not be able to fully test the reflector height value used in this web app until you look at some real data. But you can get an idea of which RH values put you over the water.
Evaluate the Data
We know that the reservoir will only be in the northeast quadrant, so I am going to select those azimuths specifically. I will start with elevation angle limits of 5-12 degrees and the superior L2C frequency.
quickLook sbas 2020 1 -e1 5 -e2 12 -h1 20 -h2 35 -azim1 0 -azim2 90 -fr 20
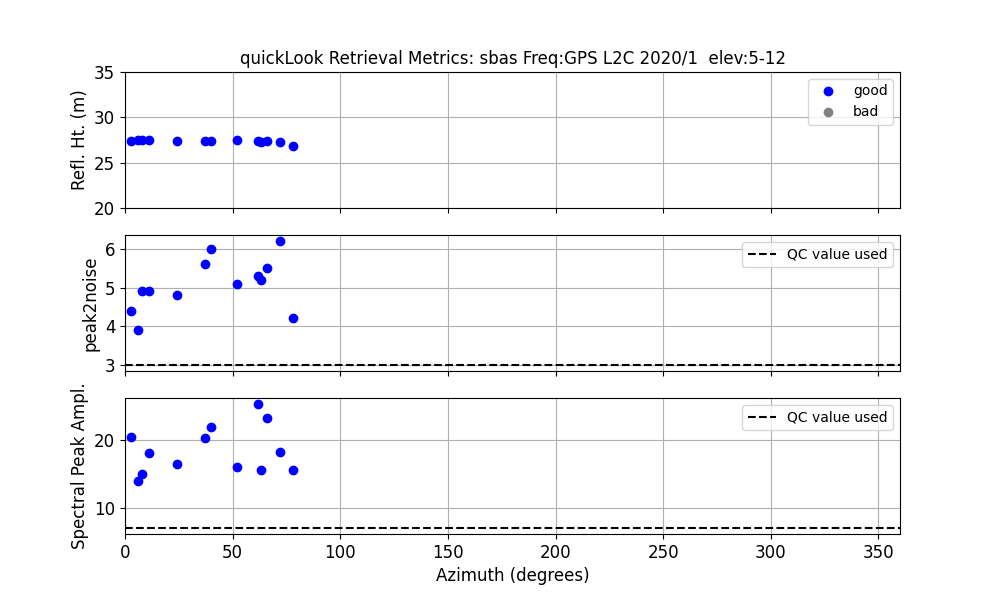
You can see that the last point looks a little bit lower than the others. If I run it again with screenstats set to True, I will get a little more information that will help me figure out how far we can go:
SUCCESS for Azimu   8.5 Satellite  1 UTC  5.96 RH  27.490
SUCCESS for Azimu  37.9 Satellite  3 UTC  8.60 RH  27.380
SUCCESS for Azimu  78.4 Satellite  5 UTC 19.64 RH  26.790
SUCCESS for Azimu  66.1 Satellite  6 UTC 16.63 RH  27.360
SUCCESS for Azimu  63.0 Satellite  9 UTC 12.10 RH  27.418
SUCCESS for Azimu  11.1 Satellite 10 UTC  1.25 RH  27.478
SUCCESS for Azimu  52.1 Satellite 12 UTC 20.56 RH  27.530
SUCCESS for Azimu  40.6 Satellite 17 UTC 14.82 RH  27.410
SUCCESS for Azimu   6.4 Satellite 24 UTC 17.65 RH  27.530
SUCCESS for Azimu  24.4 Satellite 25 UTC 21.04 RH  27.400
SUCCESS for Azimu   3.4 Satellite 27 UTC  2.28 RH  27.410
SUCCESS for Azimu  72.7 Satellite 29 UTC  0.40 RH  27.250
SUCCESS for Azimu  63.8 Satellite 31 UTC  4.96 RH  27.320
Looks like satellite 5 at an azimuth of 78.4 degrees is the problem, so we will further restrict our analysis to 78 degrees in the next section.
You might go back and use the reflection zone web app to make sure that your azimuth and elevation angles look good for a RH of 28 meters.
Estimate Lake Level
Make the SNR files:
rinex2snr sbas 2020 1 -doy_end 366 -archive special
Save your analysis strategy:
gnssir_input sbas -e1 5 -e2 12 -h1 15 -h2 35 -peak2noise 3 -azlist2 0 78
The next step is to estimate reflector heights. First do a single day using the plt option.
gnssir sbas 2020 1 -plt T
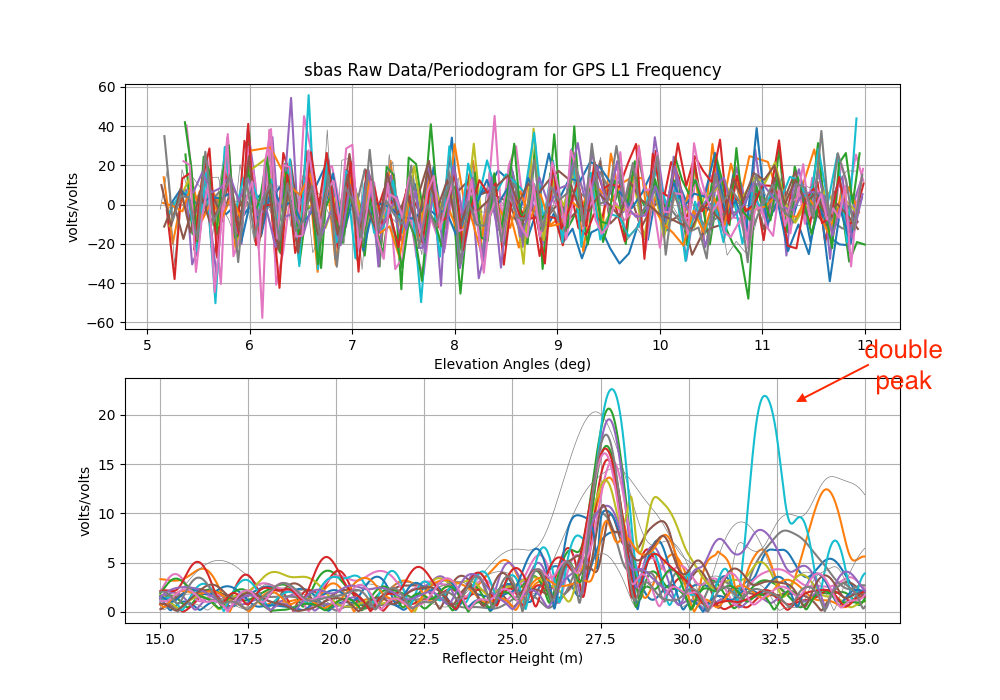
I’ve added an arrow to show you what happens if you violate the Nyquist - double peaks! Luckily this is not prevalent in this dataset thanks to the help of TRIGNET using a 15 second sample rate in the files.
The next plot will be L2C:
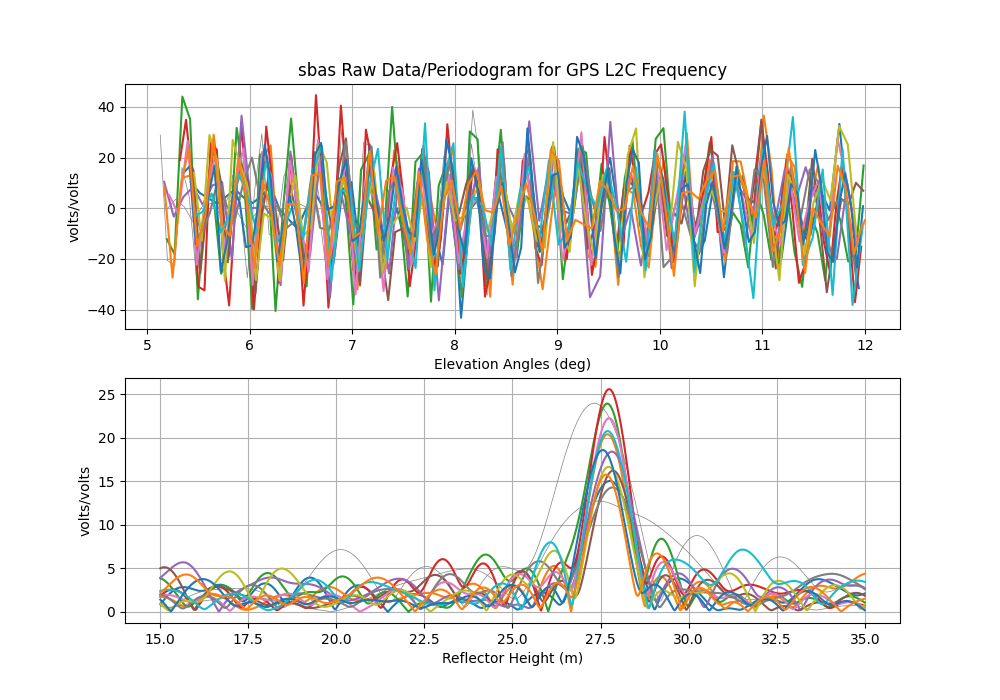
Notice that the L2C frequency - which has a longer wavelength than L1 - does not have a double peak. And that is what we should expect.
Go ahead and estimate reflector heights for all available days:
gnssir sbas 2020 1 -doy_end 366
Compute a daily average. Since we only have reflections in one geographic quadrant and are only using GPS signals, we should not require as many points as we have done in other examples. I am going to start by requiring 10:
daily_avg sbas 0.25 10
Number of available values per day:
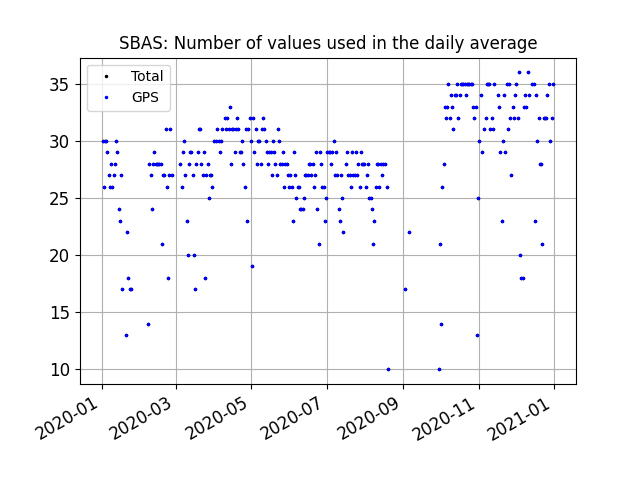
Daily average reflector height results.
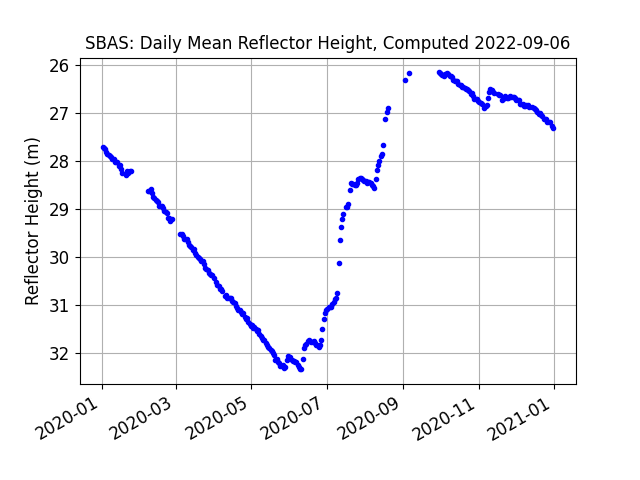
Note the missing points - this has nothing to do with reflectometry. These are days when the station did not report data. Numerical values are saved in a file. The location of the file is printed to the screen.
You should also go back and add some of those very northwestern tracks by setting a second azimuth region in your json file.
Then rerun the gnssir and daily_avg codes.
Compare with in situ data:
Current state of the lower Steenbras reservoir
This is a link for all reservoirs
Simon Williams found this web app that will provide 2020 data for a comparison
As a final remark, there are lots of lake/reservoir/river gauges around the world. The beauty of using this GPS dataset to measure the reservoir level is that you can combine these RH values with the height estimates from “normal” GPS. This means your reservoir measurements are in ITRF and that is something no other in situ lake level measuring system can do.
Kristine M. Larson September 6, 2022