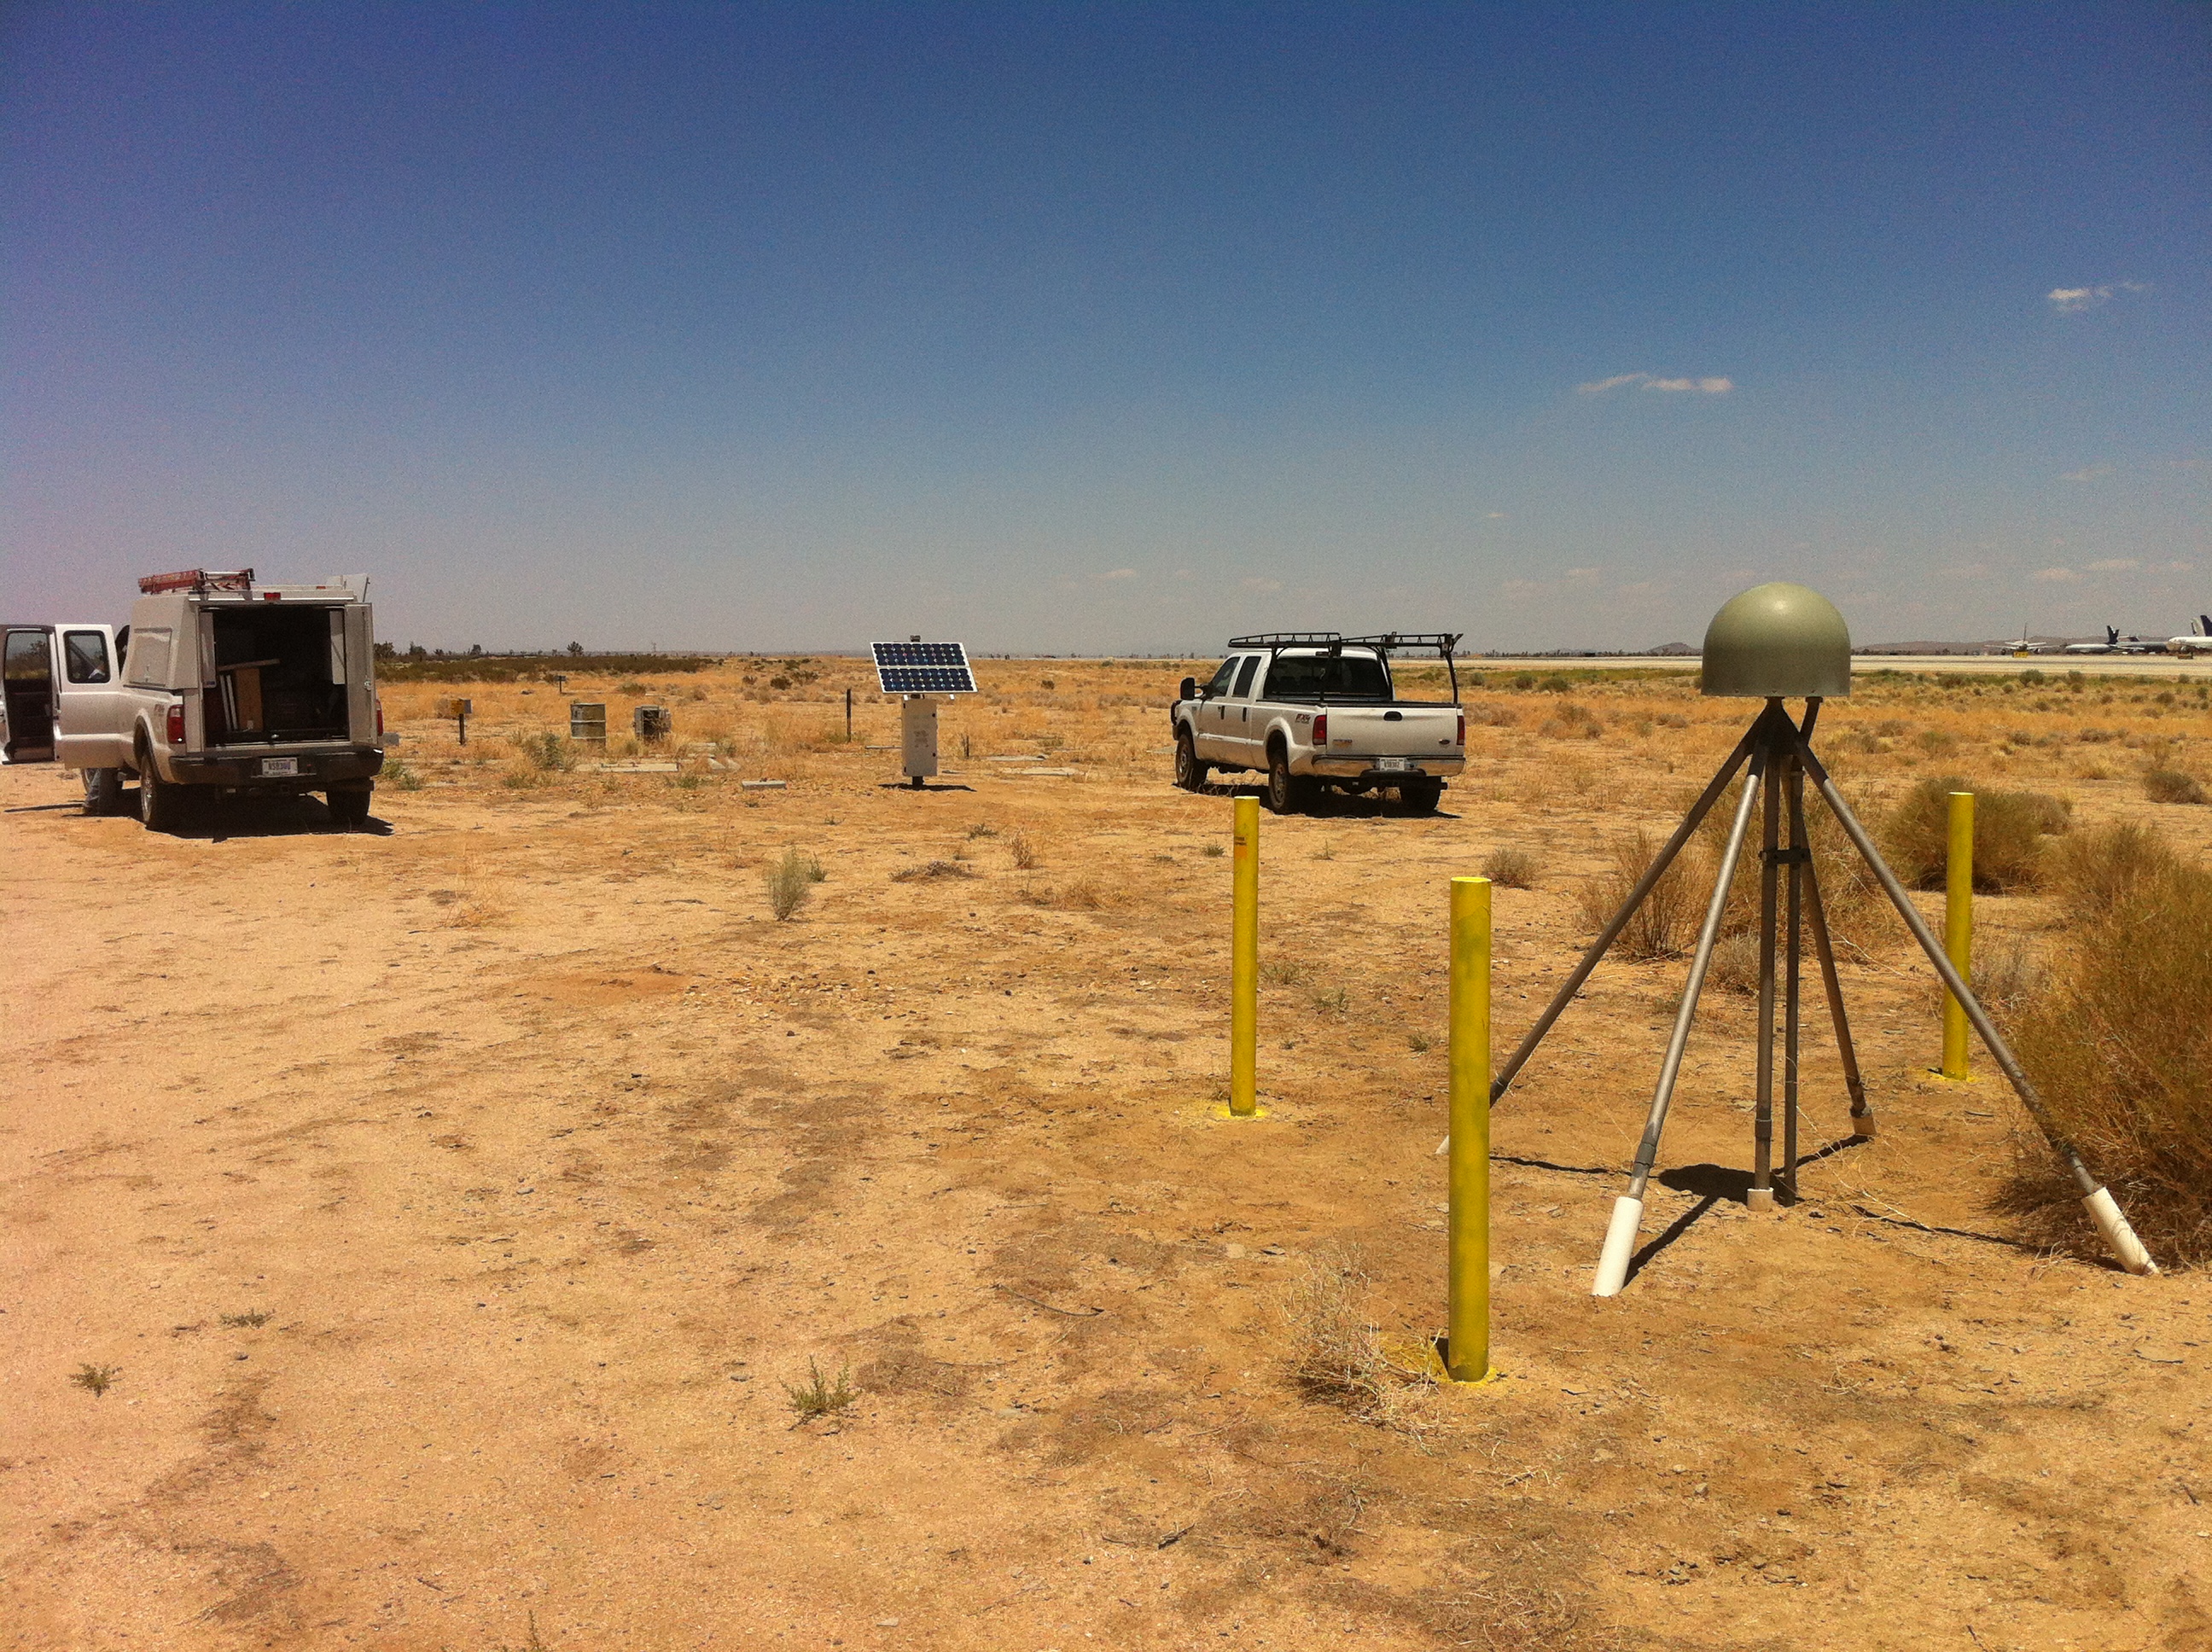
Airport near Victorville, CA
Note: since v4.1.3, the multi-year vwc/phase workflow has changed; we use -legacy T here for compatibility with previous versions.
scia
Location: Victorville, California, USA
Archive: UNAVCO
Station Page at Nevada Geodetic Laboratory
L2C data are available at UNAVCO in the standard RINEX files for this site starting in 2018.
Translate the SNR data/Estimate RH
rinex2snr scia 2018 1 -archive unavco -doy_end 366 -year_end 2020
Take a quick look at the L2C data:
quickLook scia 2018 1 -fr 20
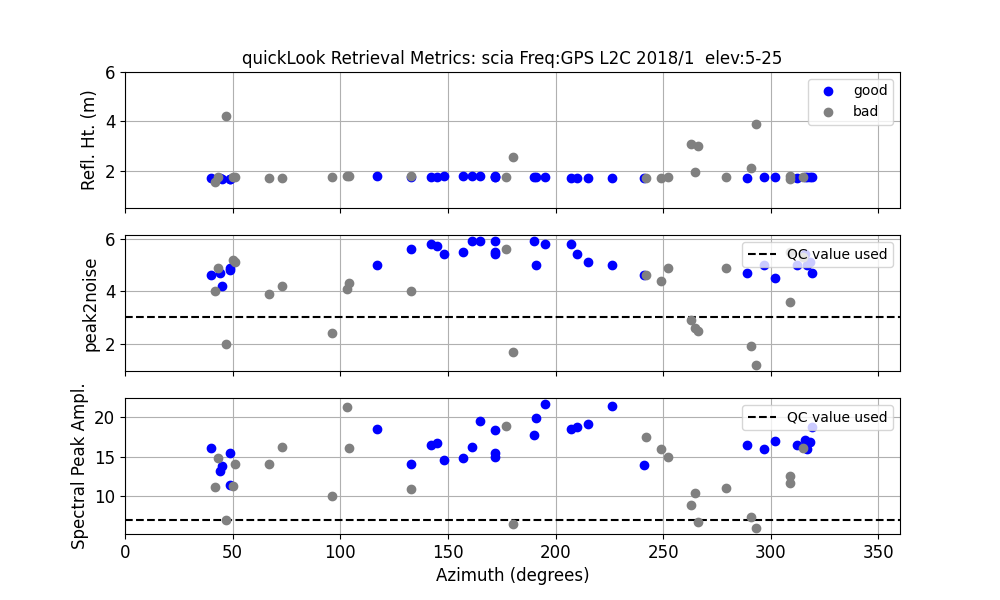
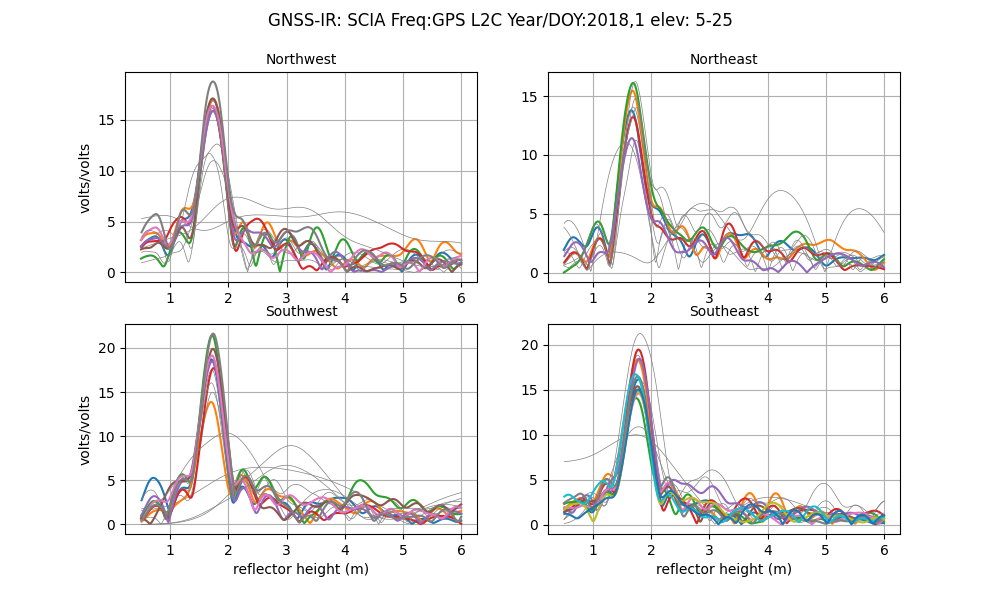
These are Lovely reflections!
Set up (default) analysis stratgegy:
gnssir_input scia -l2c T
Estimate reflector heights:
gnssir scia 2018 1 -doy_end 365 -year_end 2020
Estimate Soil Moisture
Please read the soil moisture user manual. It is very short and has a lot of tips that will save you time.
We need a list of satellite tracks to use. We’ll use 2019 for now as the year:
vwc_input scia 2019 -legacy T
Estimate the phase for each satellite track on each day:
phase scia 2018 1 -doy_end 366 -year_end 2020 -legacy T
Finally, convert the phase to volumetric water content. To make it easier to look at the plots, I’ll just show the first two years:
vwc scia 2018 -year_end 2019 -legacy T
Phase results plotted in geographic coordinates:
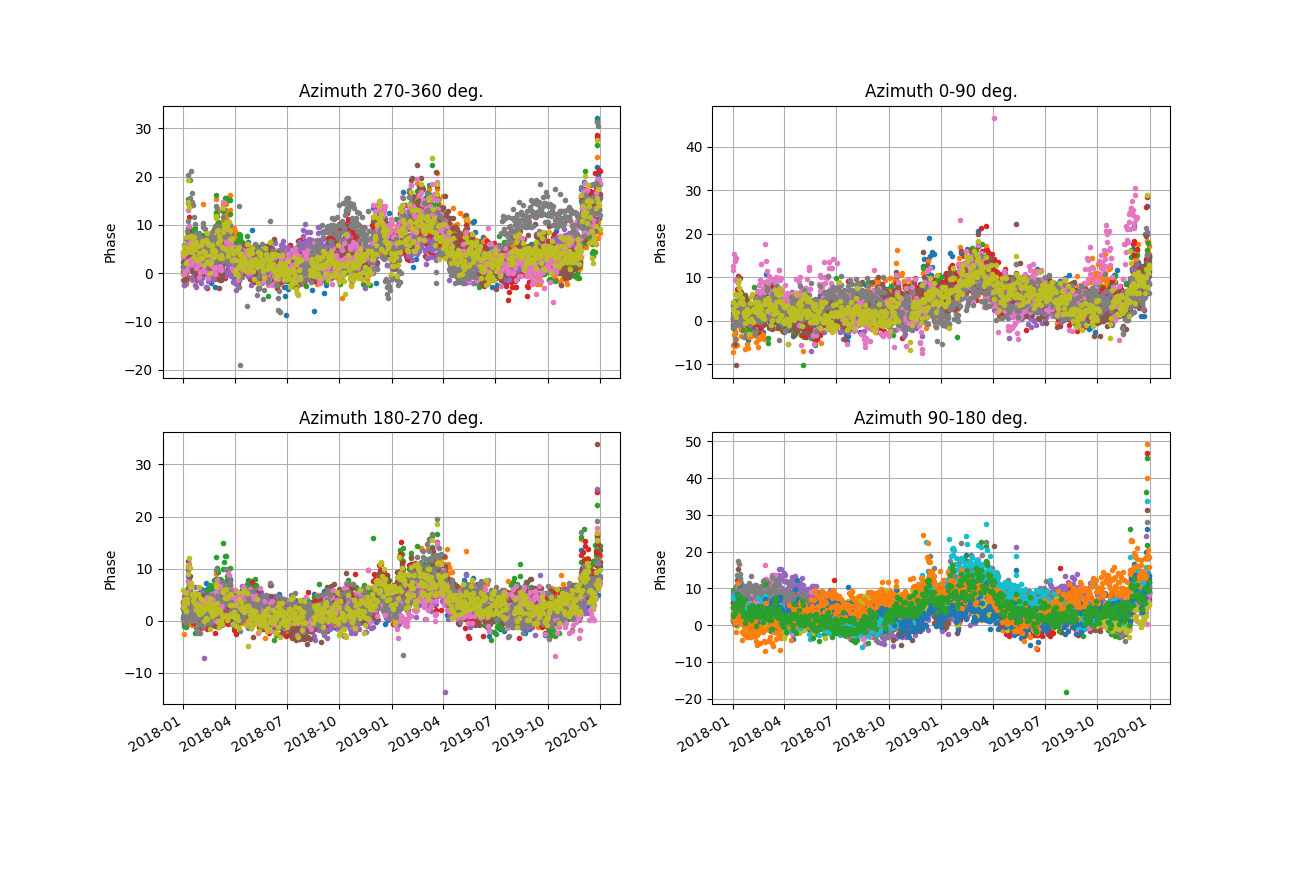
Daily average phase:
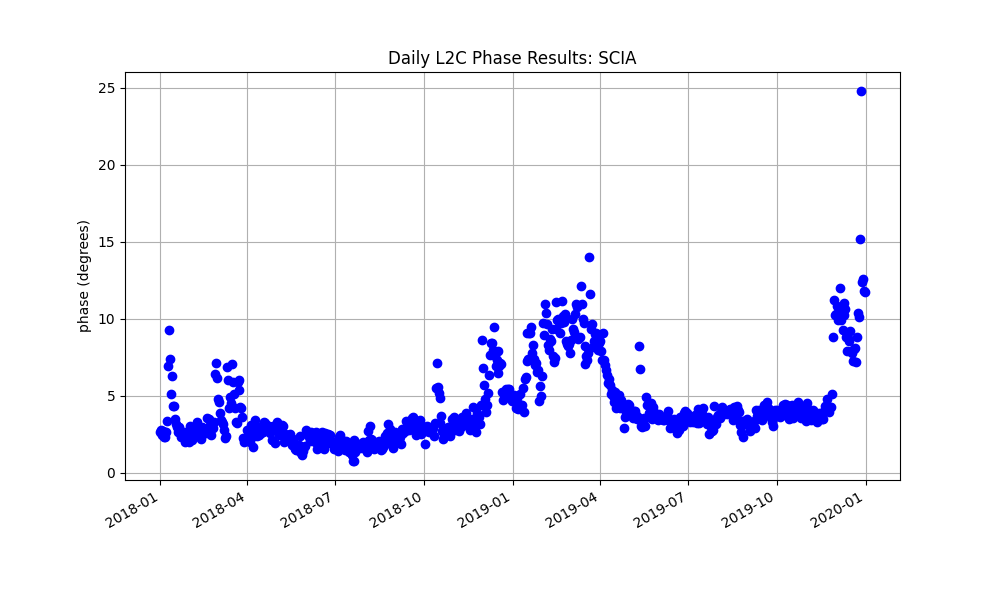
What is going on at the end of 2019? A little googling:

If it is just rain, that’s ok. If it is snow, that last very high point in 2019 is contaminated. This site says it was snow!
Final plot:
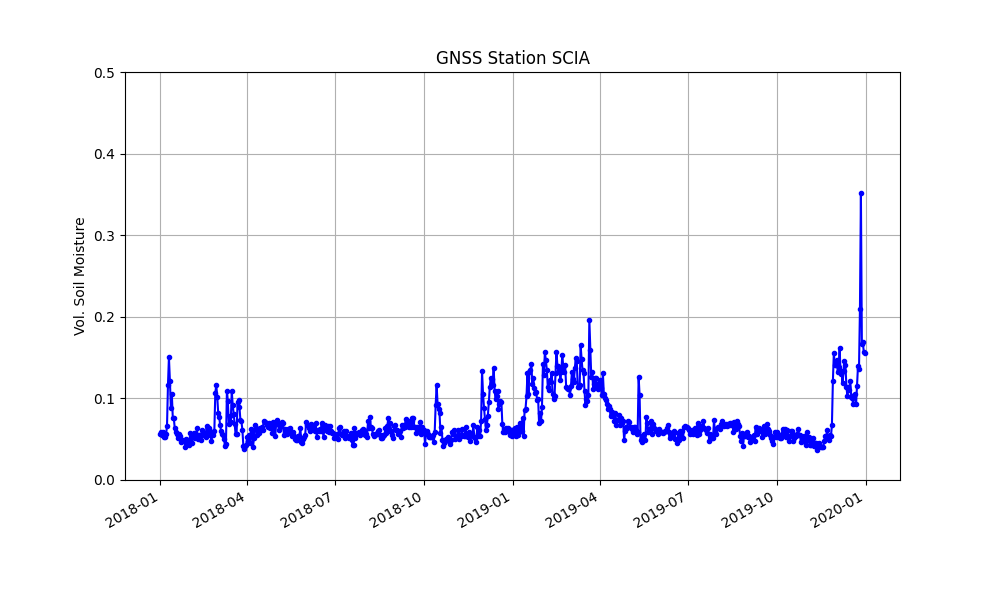
VWC results are written to:
$REFL_CODE/Files/scia/scia_vwc_L2_24hr+0.txt
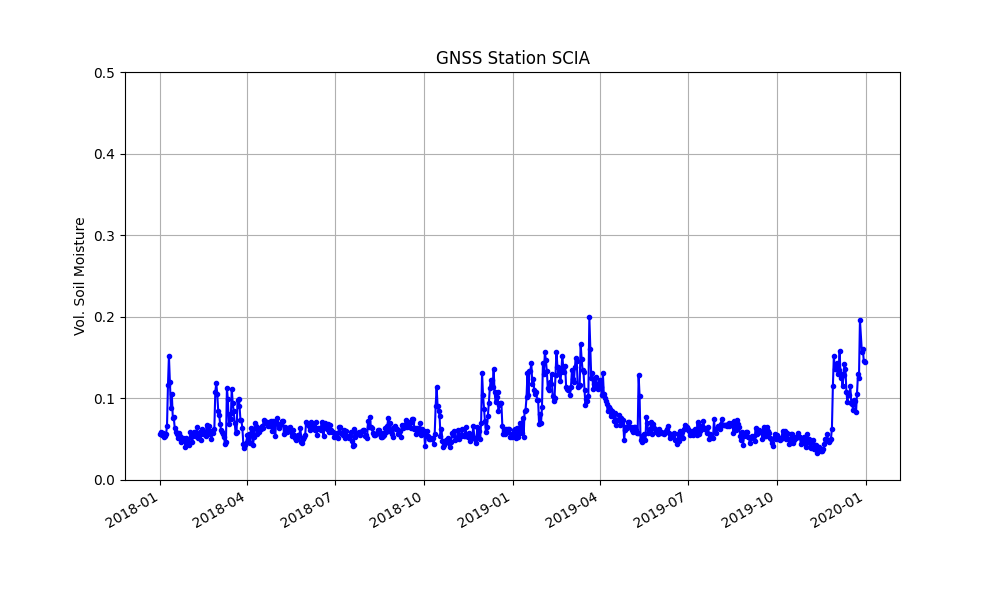
Let’s try to get rid of that snow outlier. I could look in the vwc file to see what day has a very large value. Or you can also try setting -snow_filter to True. When I ran it, it did not create a snow outlier file - but it did tell me where it is stored and what format it needed (year and day of year).
$REFL_CODE/Files/scia/snowmask_scia.txt
So I went ahead and made that file with one line in it, 2019 361
Then I ran the vwc code again:
vwc scia 2018 -year_end 2019 -snow_filter T -legacy T
Produces:
Now let’s look at three years:
vwc scia 2018 -year_end 2020 -snow_filter T -legacy T
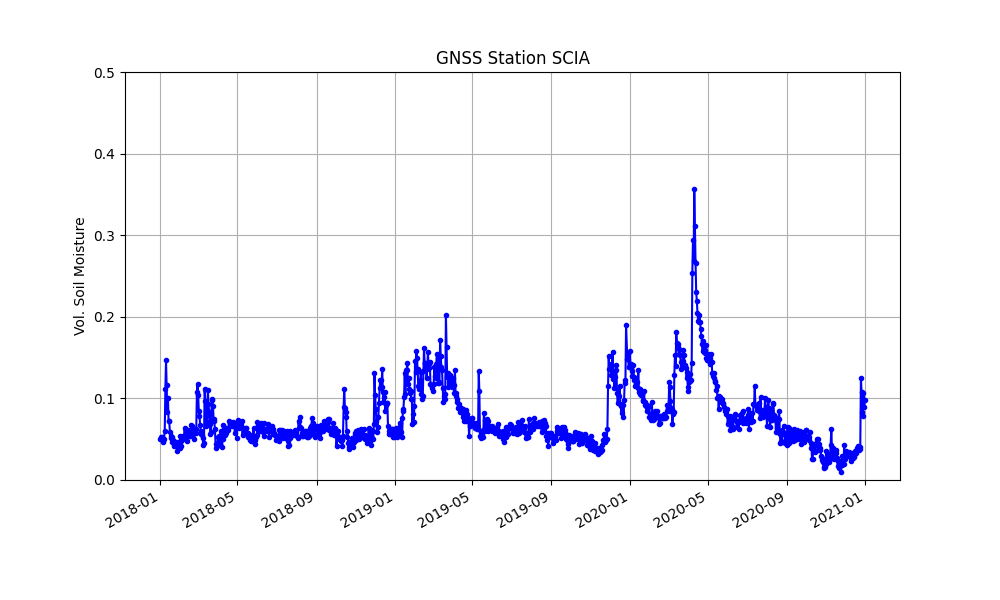
There is what appears to be a big precipitation event followed by a drydown in April 2020. What does the weather station say?