Grauerort-Reede
tggo
Unfortunately these data are no longer available from BFG.
RINEX 3 name: TGGO00DEU
Location: Elbe River, Germany
Archives: BFG
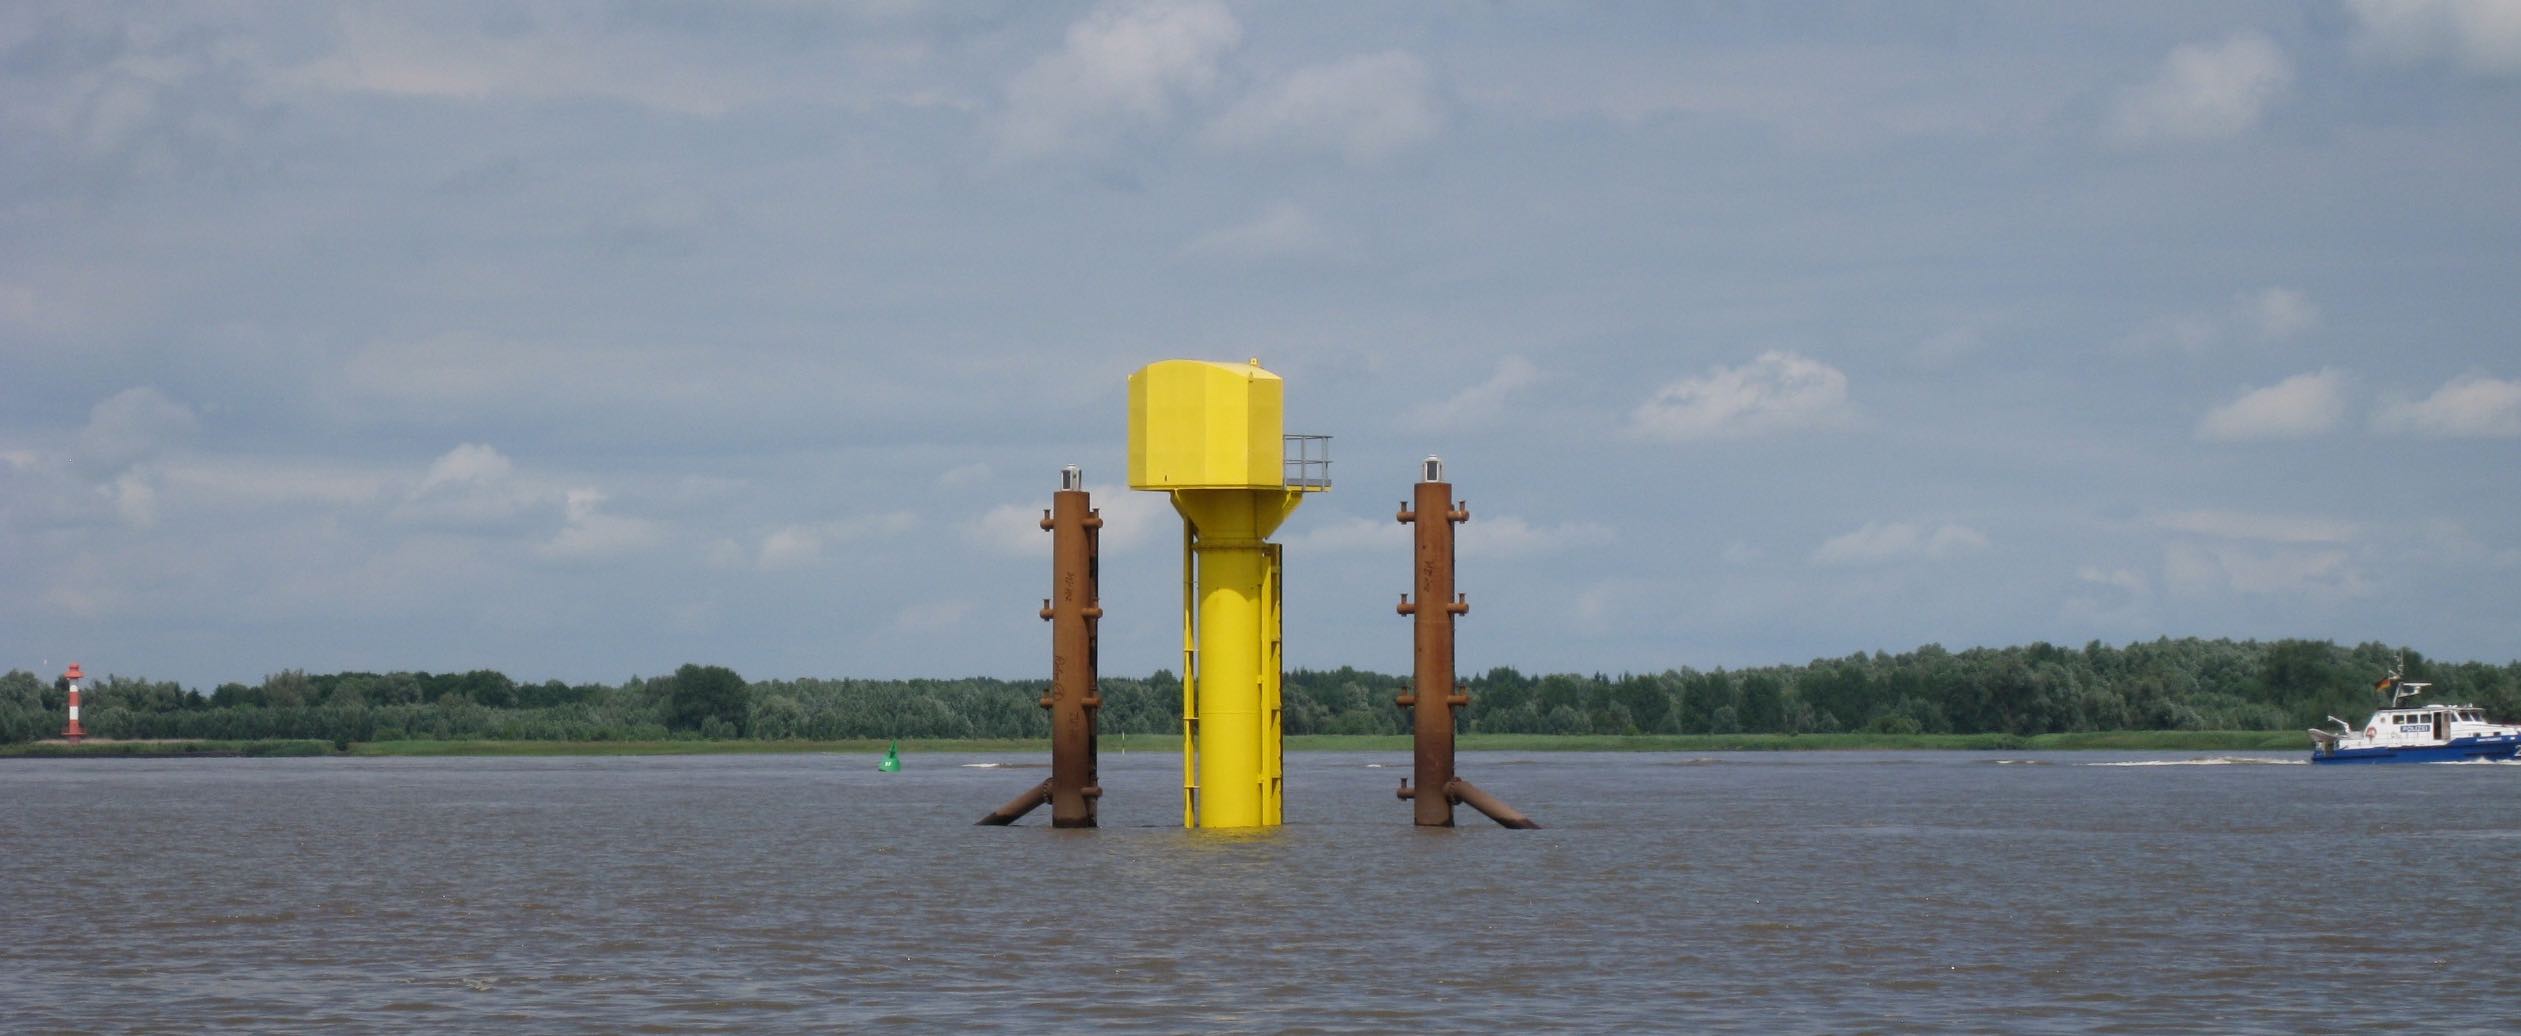
TGGO is a station in the BfG-GNSS Monitoring Network. It is located in the Elbe River. It is colocated with a tradtional tide gauge. It has excellent visibility of the water.
Reflection Zones for TGGO
Type tggo into the station name for our reflection zone web site. Generally for water, I recommend using up to 15 degree elevation angles. Note that the height of the GNSS antenna above sea level is returned on the right hand side. We will compare that value with the estimated reflector height. It does look like there might be some kind of pier that we should avoid
Make a SNR file
Because the GNSS station is ~12 meters above the water, we are too close to the L1 Nyquist for a receiver that is sampling at 30 seconds. You need to use the 15 second files that BFG started producing in summer 2022. If you use the 30 second files, some of your solutions will be inaccurate. Make the following choices:
station : tggo00deu (the longer station name will tell the code to find RINEX 3 instead of RINEX 2.11)
archive : bfg
orb : rapid (you can also use gnss if you prefer)
samplerate : 15
rinex2snr tggo00deu 2022 234 -archive bfg -orb rapid -samplerate 15
You will need a password for the BFG archive. This is available upon request by sending an e-mail to gnss@bafg.de.
You will only need to enter the password once as gnssrefl will save it to your local system.
While you can also find TGGO data at SONEL, it will almost certainly be the 30 second data which is not acceptable
for L1 frequencies.
First evaluation of the data for TGGO
I am going to use year 2022 and day of year 234 and frequency 20 (which means L2C). I will further restrict elevation angles to 5-15. In order to see the water, you need to set the reflector height limits to include the vertical distance to the water with the optional parameters h1 and h2.
quickLook tggo 2022 234 -fr 20 -e1 5 -e2 15 -h1 6 -h2 18
The first plot shows periodograms in the four geographic coordinates.
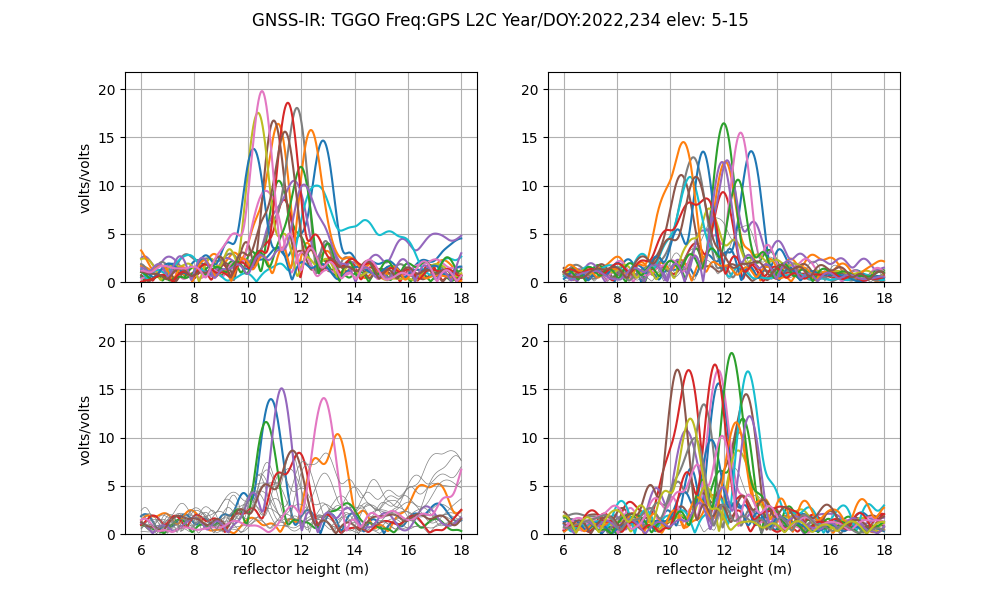
These are summarized below.
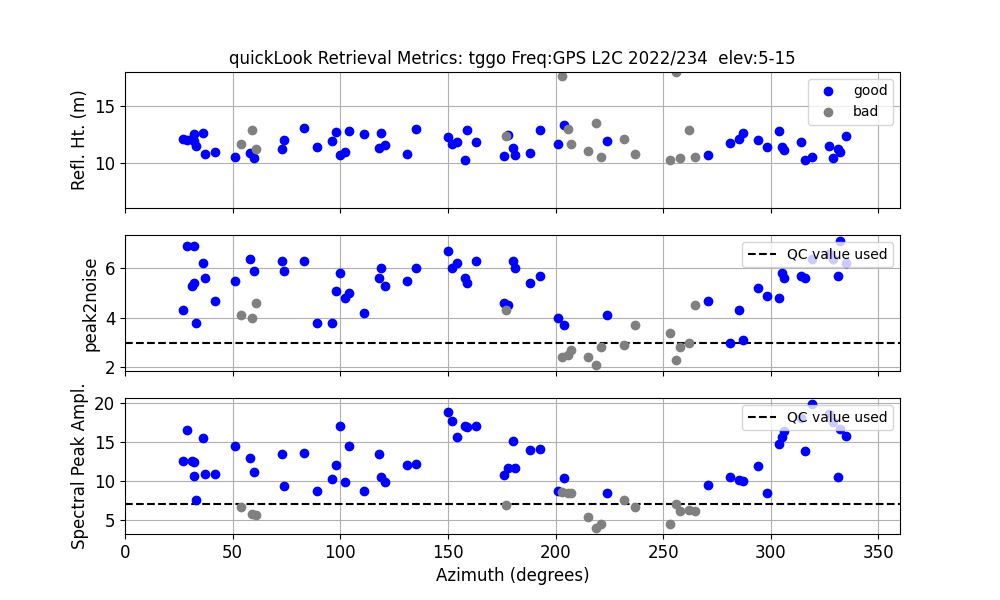
All three plots are with respect to azimuth in degrees. On the top plot, the “blue” retrievals show that the GNSS antenna is indeed ~12 meters above the water. The variation in reflector height (with respect to azimuth) are the tides. The poor retrieval region roughly corresponds to where we saw the pier in the photograph.
I kept the reflector height regions quite large since I was not sure how much the tides varied here. While it is ok to keep this region large, the noise metrics will likely need to be adjusted. In this case most of the good peak regions are above peak2noise of 4.
Analyze the data
Go back and make SNR files for a longer time period:
rinex2snr tggo00deu 2022 226 -doy_end 240 -archive bfg -orb rapid -samplerate 15
The next step is to save your analyis strategy using gnssir_input.
gnssir_input tggo -h1 6 -h2 18 -e1 5 -e2 15 -h1 6 -h2 18 -allfreq T -azlist2 30 180 270 330 -peak2noise 4
Now estimate reflector heights for these same dates:
gnssir tggo 2022 226 -doy_end 240
To put those results all together:
subdaily tggo 2022
Multiple figures come to the screen. The first will summarize how much each constellation contributes. Because of restrictions for this particular receiver type, the Galileo signals are degraded for reflections. When a new receiver is installed, the Galileo retrievals will significantly improve.
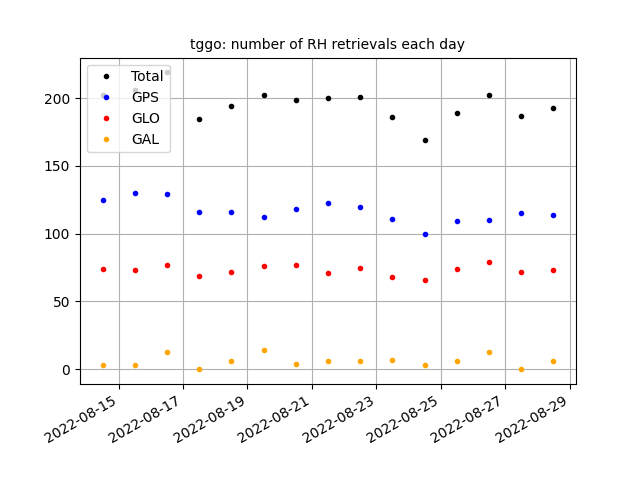
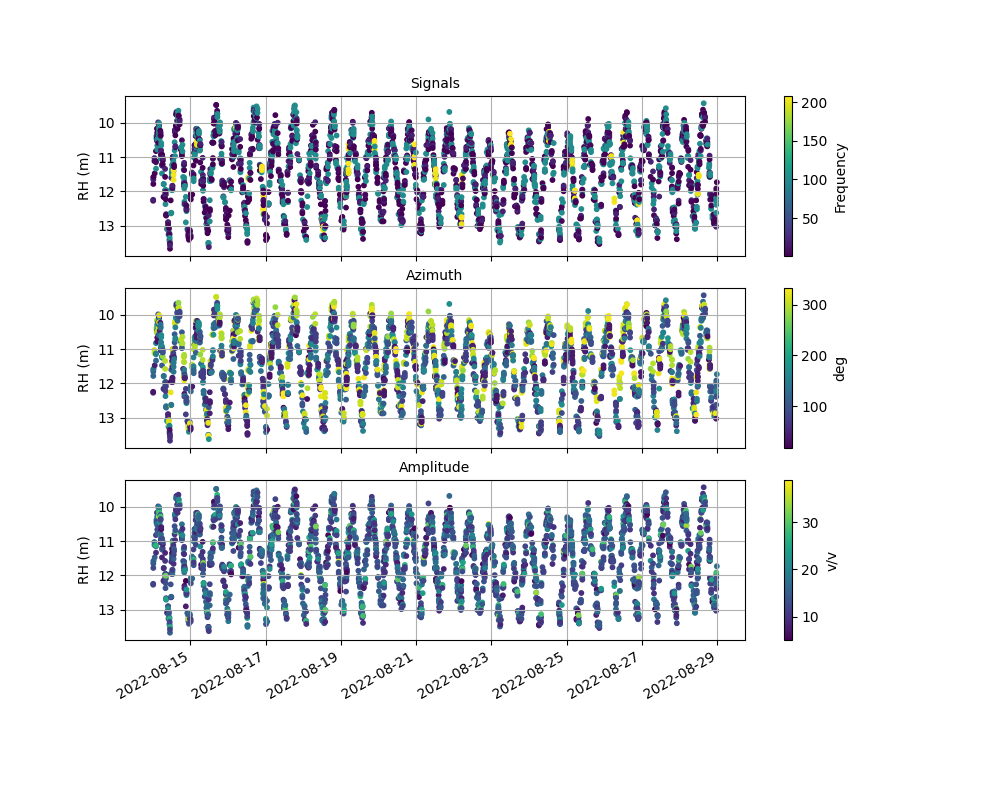
The reflector heights are then plotted as a function of constellation (GPS, Glonass, Galileo), azimuth, and amplitude of the reflector height periodogram. These can be useful if you are trying to assess whether your azimuth mask is working.
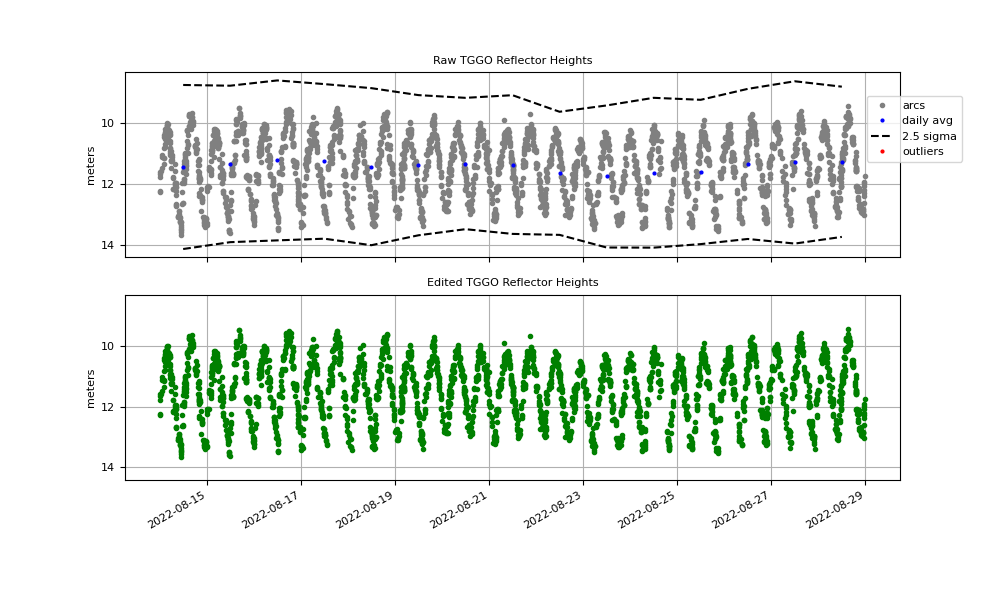
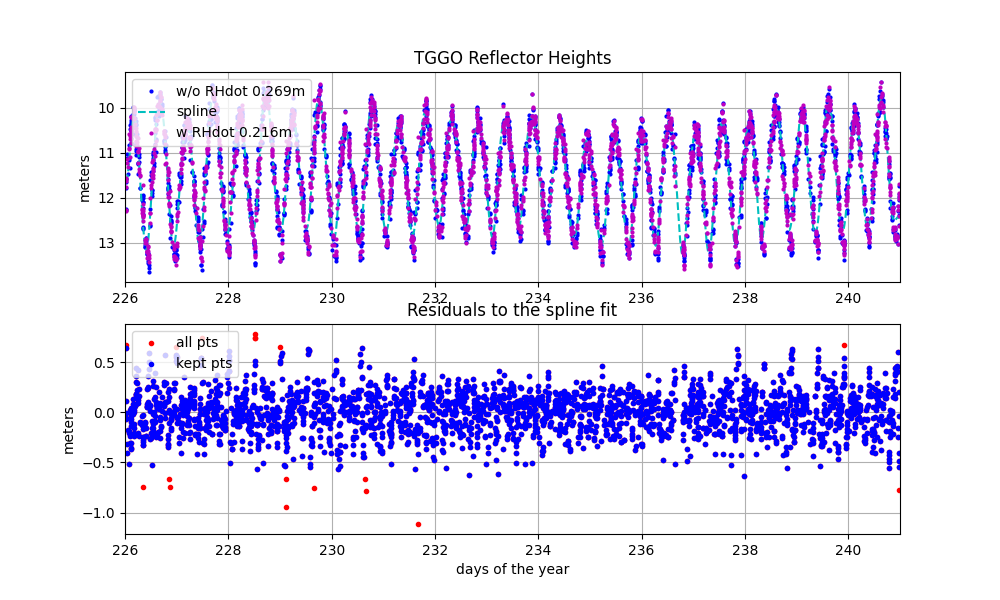
Time series with large outliers removed.
In order to compute the RHdot correction, the code uses a spline fit to our initial RH estimates.
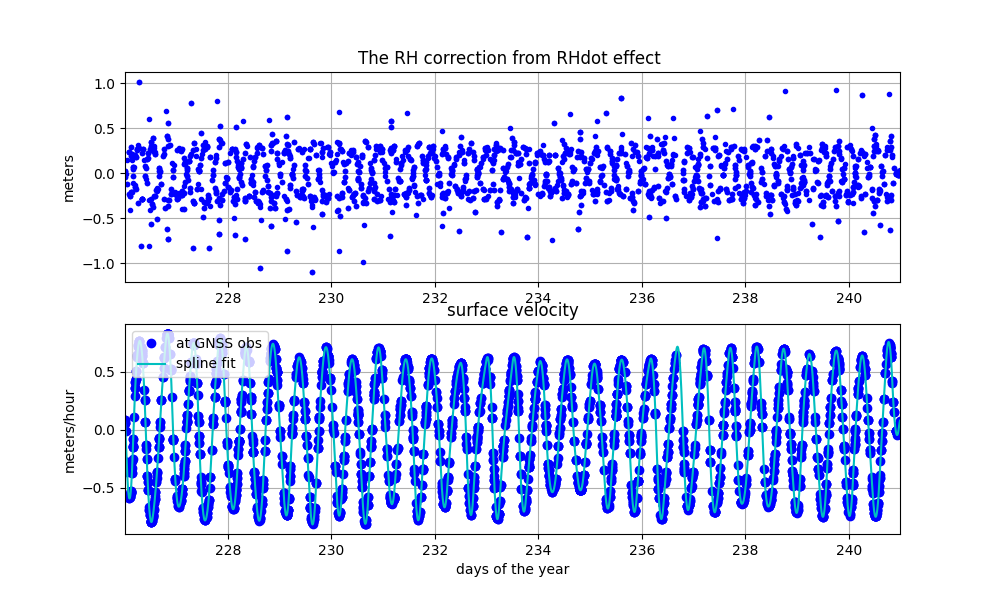
The outliers in the RHdot correction plot above are disturbingly large. If you look at the file with
the corrections in it (the name of the file is sent to the screen), and simply look
at which satellites have the largest outliers, you find that they have a
delT (length of the arc) of more than 60 minutes, whereas the vast
majority of the arcs are less than 30 minutes. Such a long arc is
perfectly fine for computing snow depth or lake heights - significant
subdaily behavior is not expected. For tides where tidal rates are
significant, as they are at this site, the gnssrefl code is not going to be
able to use a simple fit to find the RH dot
correction. The best thing to do is to change the delT parameter in the json file to ignore these
long arcs. The default was 75; I changed mine to 35 minutes. I also removed all the Galileo frequencies
are there aren’t enough to be useful. I then reran gnssir and subdaily.
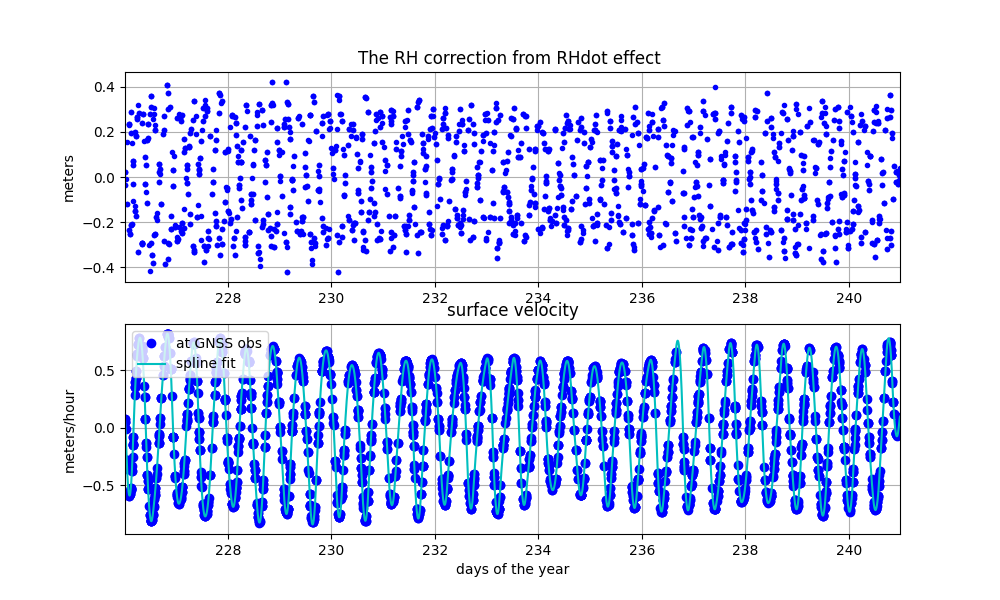
You can see now that those big RHdot outliers are gone:
The statistics for the fits are then printed to the screen. Note, these are relative to a spline, which is not truth, but it is better than nothing.
Please note that the new RH values are being written to a new column! Please look into the file.
The code will then remove interfrequency biases and recompute a spline:
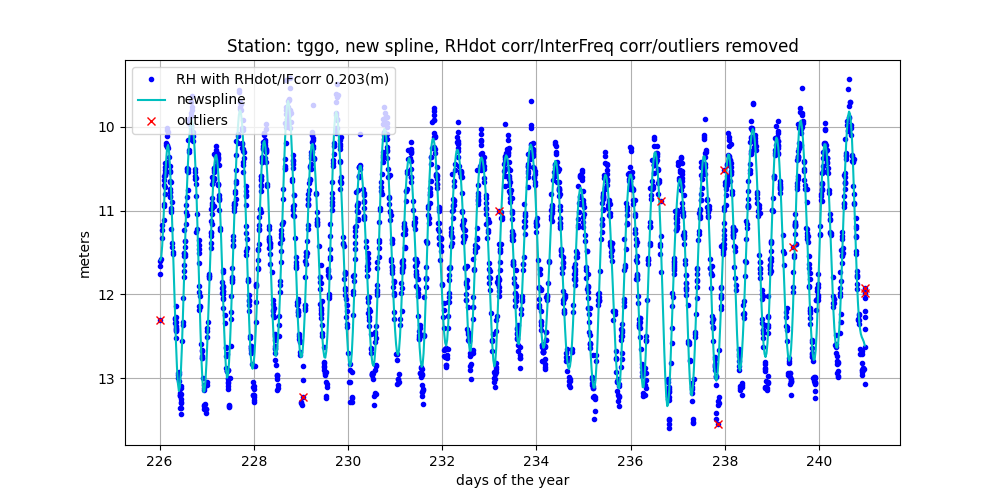
Please note that the IF corrected RH values are being written to a new column! Please look into the file.
From the limited comparisons I have done with truth data from the WSV, the precision for each track is about 16 cm at this site. This site would be better if it could track more Galileo satellites. When this current receiver is upgraded to a newer model, I expect to see much better results.
Updated
Kristine M. Larson June 29, 2023