Lake Taupo
Try using -par 10 when running gnssir.

Photo credit: Simon Barker
metadata
Station Name: tgho
Location: North Island, New Zealand
Archive: Geonet
DOI: N/A
Ellipsoidal Coordinates:
Latitude: -38.813
Longitude: 175.996
Height: -38.813 m
Data Summary
Station tgho is operated by GNS. The GNSS site is located on a platform in Lake Taupo. It records standard GPS and Glonass signals at a low sample rate (30 sec). The site could be significantly improved with a newer receiver that tracks modern signals at a higher sample rate.
Take a Quick Look at the Data
Begin by making an SNR file. Use both GPS and Glonass and set the archive to nz or sopac (downloading from nz tends to be slow from Europe and the Americas):
rinex2snr tgho 2020 300 -orb gnss -archive nz
quickLook tgho 2020 300 -e1 5 -e2 15
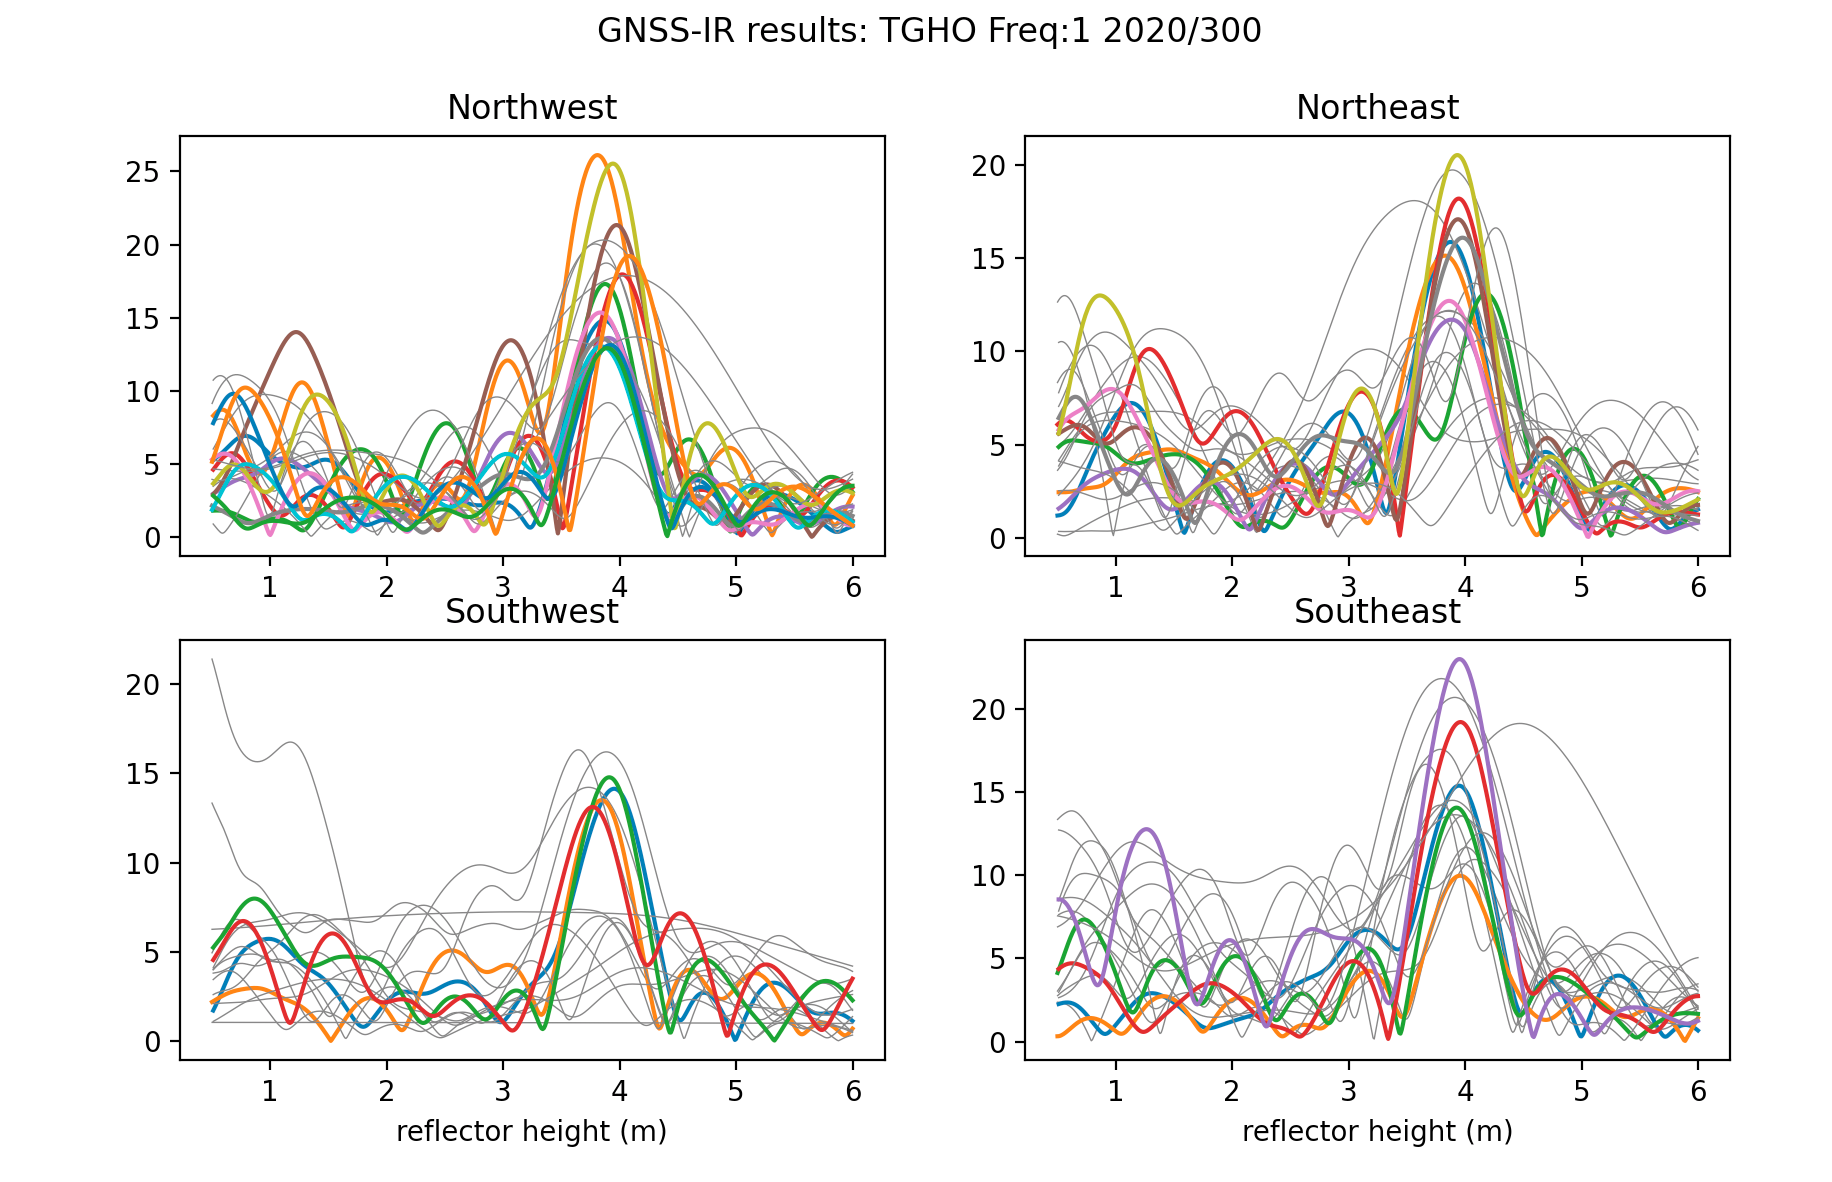
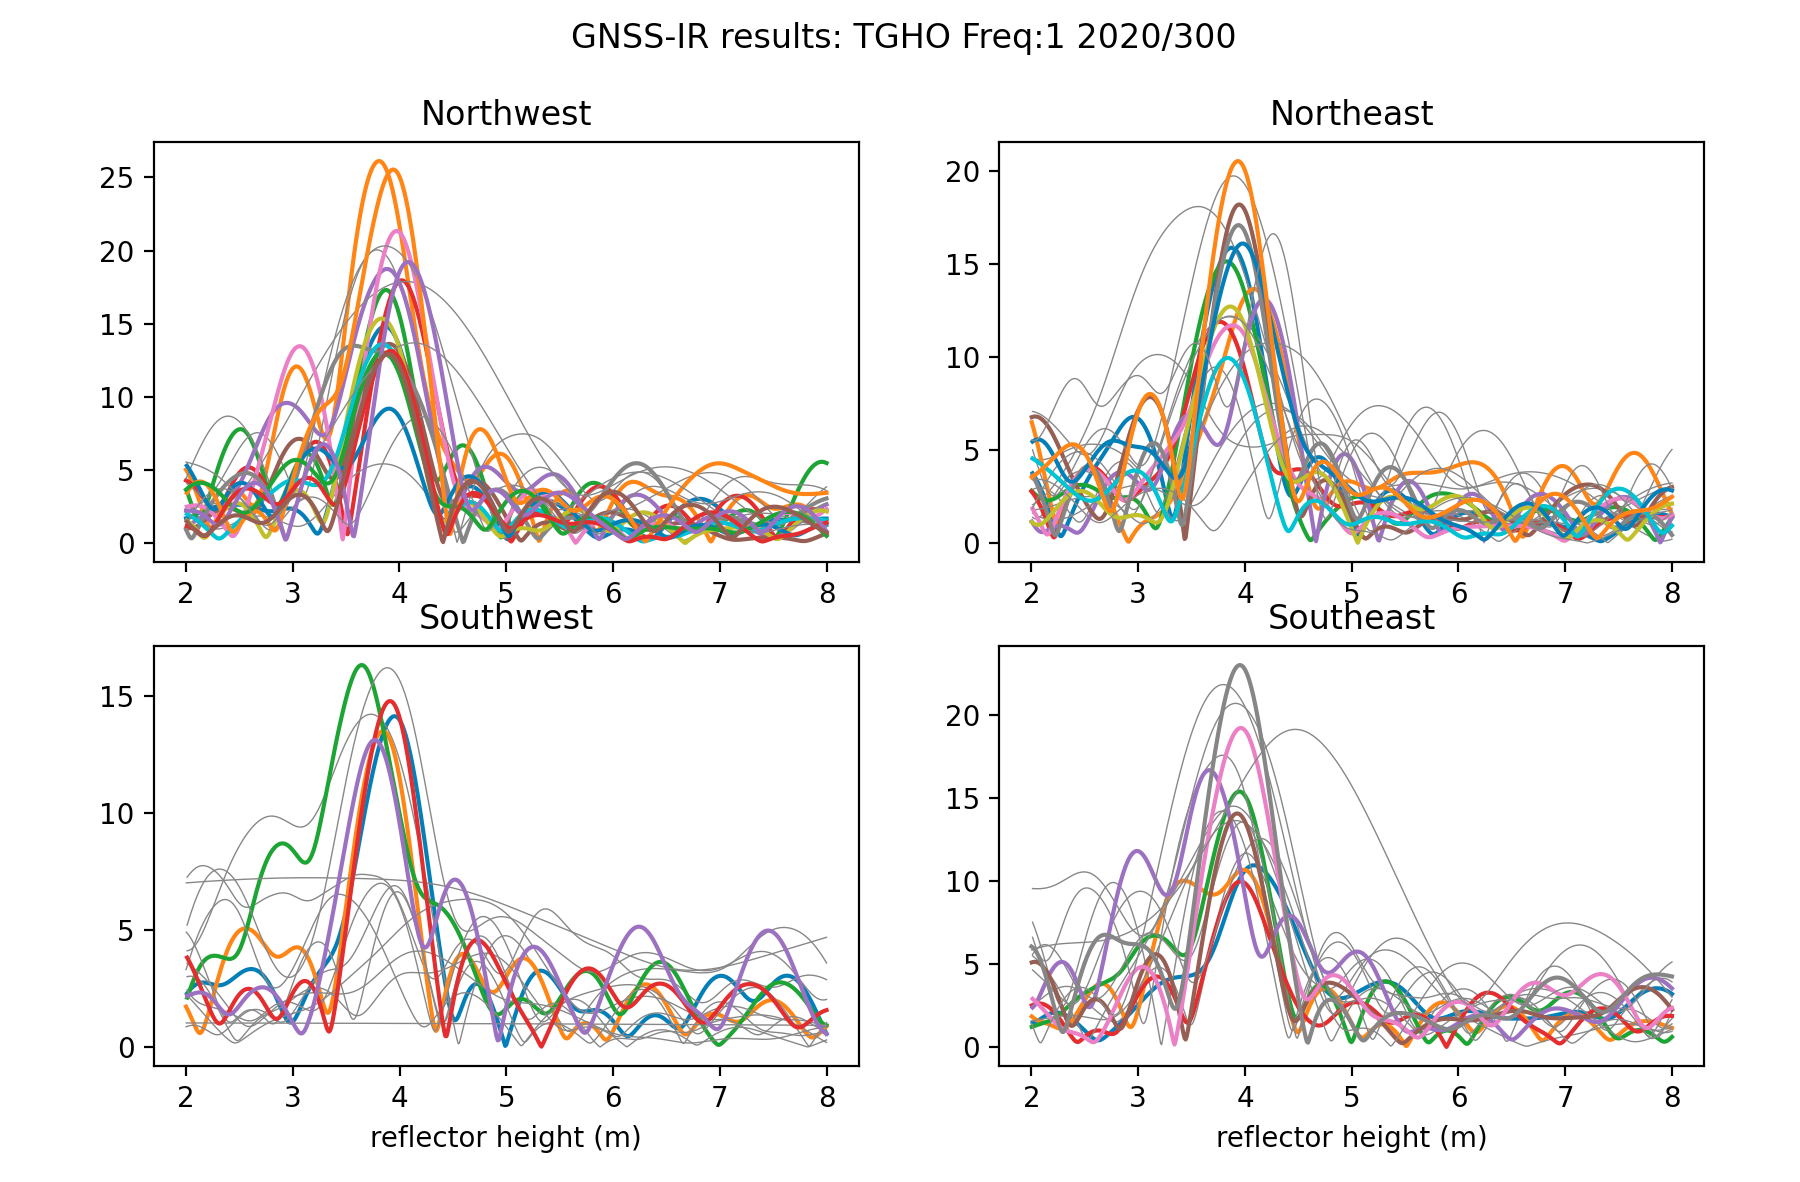
The clutter near the monument produces noise at the small RH values. A better result can be found if those values are eliminated by setting h1 to 2. We also extend h2 to 8.
quickLook tgho 2020 300 -e1 5 -e2 15 -h1 2 -h2 8
Now try looking at the periodogram for L2:
quickLook tgho 2020 300 -e1 5 -e2 15 -h1 2 -h2 8 -fr 2
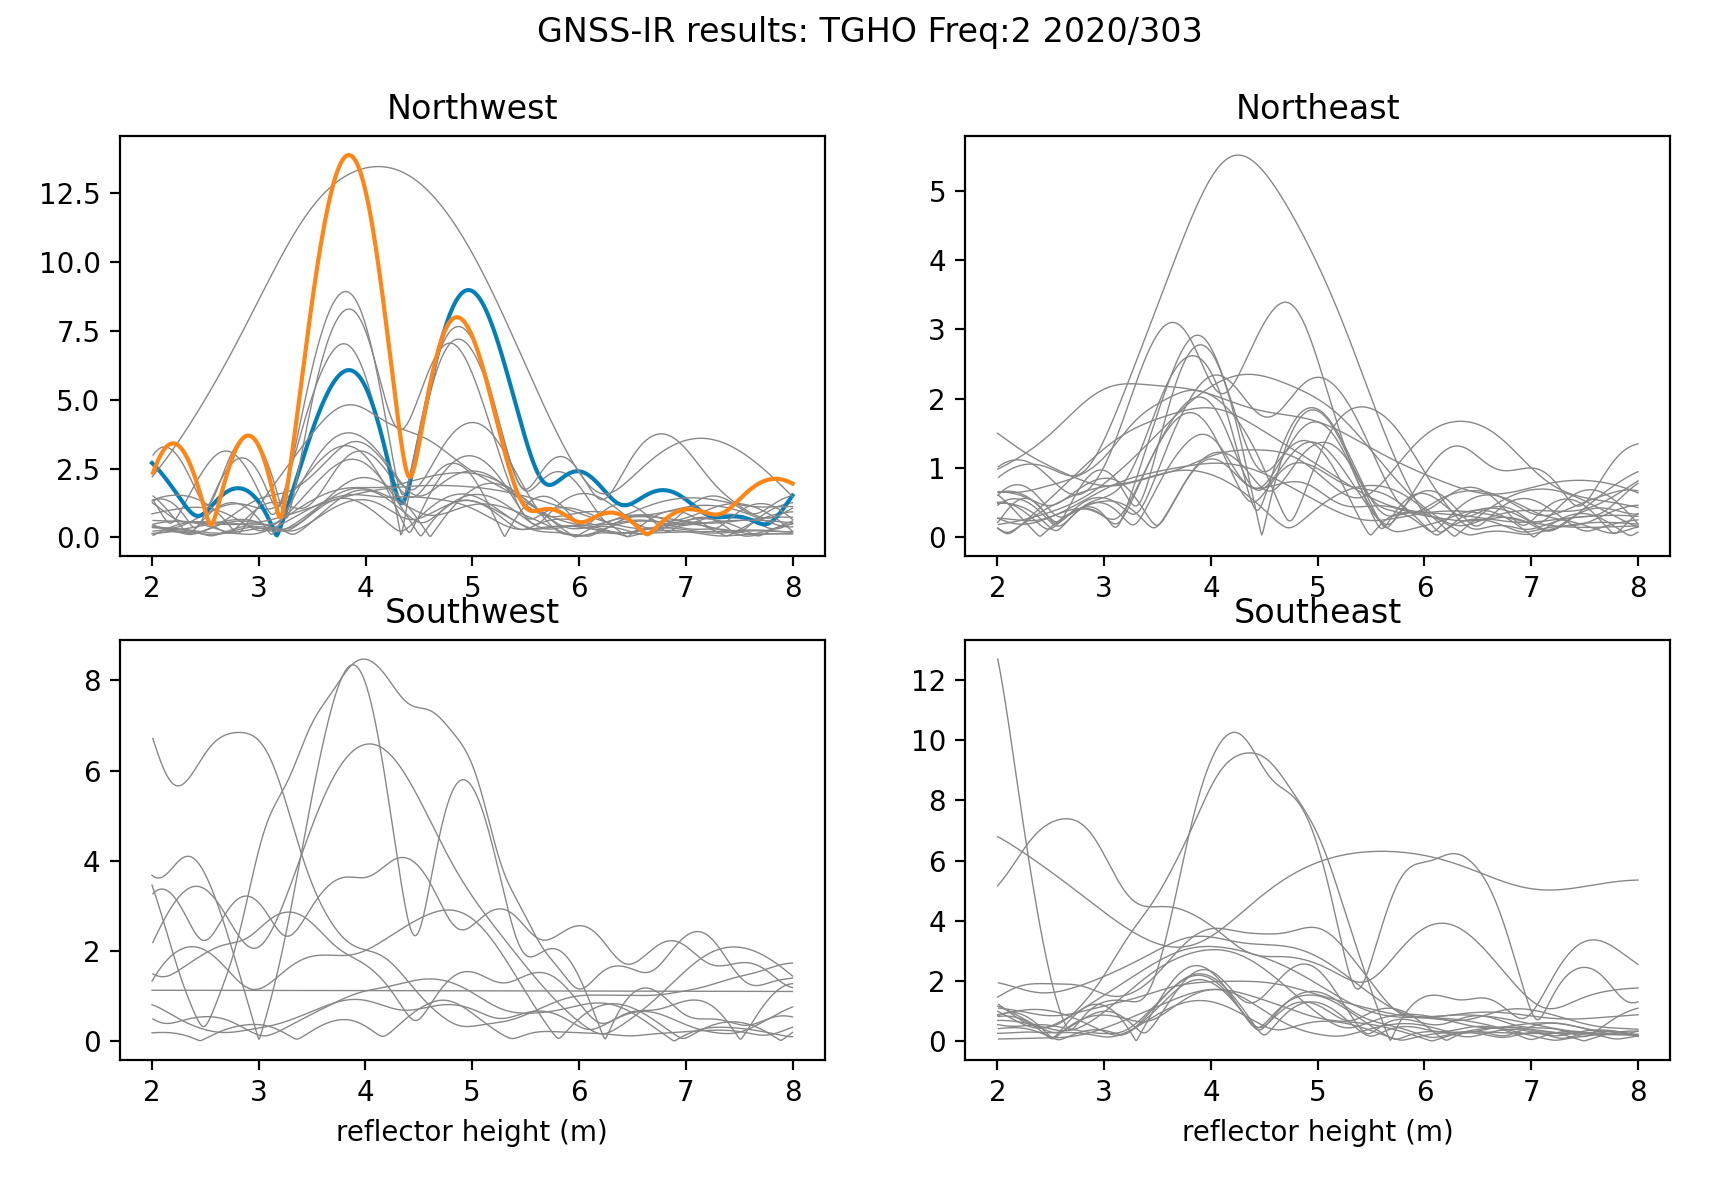
These results are not very compelling for a variety of reasons. The GPS L2 data will not be used in subsequent analysis. We will exclude 135-225 degrees in azimuth. We will require an amplitude of 9 and a peak to noise ratio of 3.0.
Users are encouraged to examine Glonass results on their own.
Analyze the Data
Set the analysis parameters using what you learned from quickLook.
gnssir_input tgho -h1 2 -h2 8 -e1 5 -e2 15 -peak2noise 3 -ampl 9 -azlist2 0 135 225 360 -frlist 1 101 102
Note the -frlist entries. I am asking for GPS L1 and Glonass L1 and L2. The GPS L2 are not high quality and there are no Galileo or Beidou data.
Then make SNR files for about six months:
rinex2snr tgho 2020 130 -archive nz -doy_end 319 -orb gnss
The output SNR files are stored in $REFL_CODE/2020/snr/tgho.
Now run gnssir for these same dates:
gnssir tgho 2020 130 -doy_end 319
To look at daily averages, use the utility daily_avg. The median filter is set
to allow values within 0.25 meters of the median, and the minimum number of tracks required to
calculate the average is set to 50 tracks.
daily_avg tgho .25 50
The number of retrievals each day is show here:

All retrievals are shown here:
Note in particular that there are quite a few data outages in this series, which means the RINEX files were missing from the NZ archive.
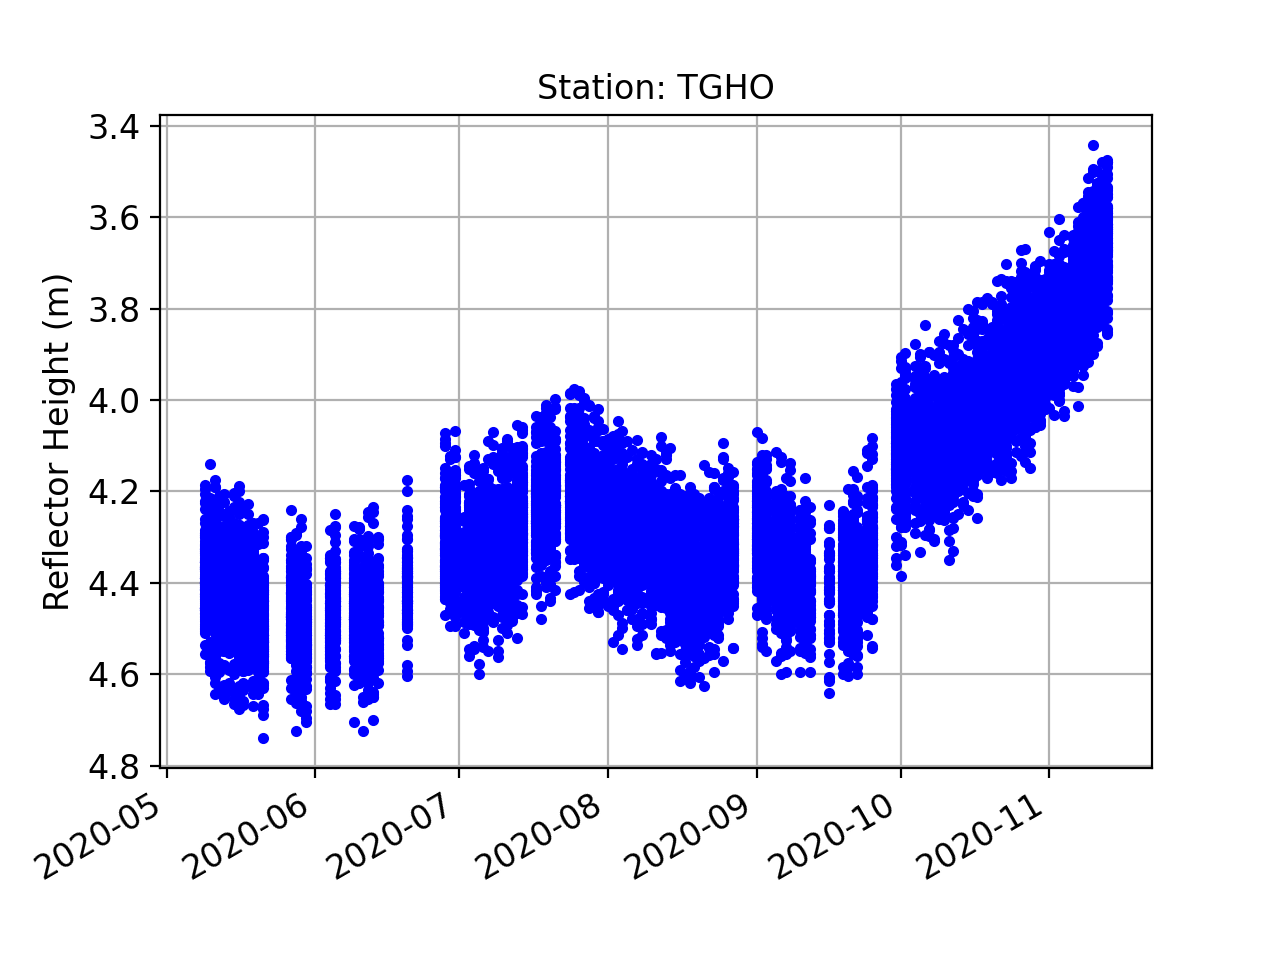
Finally, the average RH plot:
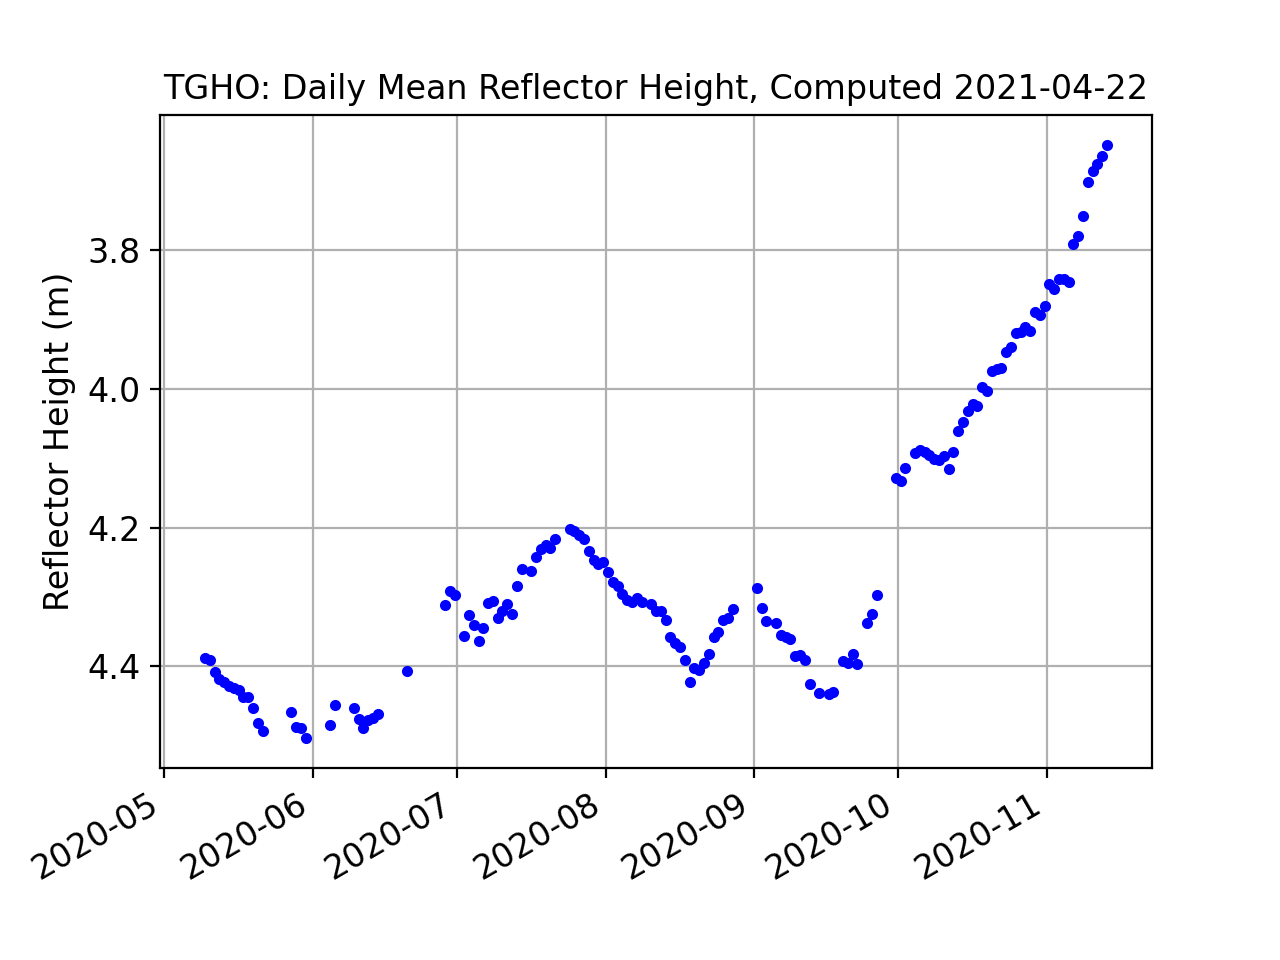
Although Taupo is in a volcanic caldera, lake levels are determined by seasonal processes such as evaporation, precipitation, input from local drainages, and outflow. The Waikoto River is sole river draining the lake, and river flow is regulated by a series of hydroelectric dams.