Utqiagvik, Alaska
Note: this use case needs to be updated to use the snowdepth utility.
Updated gnssir_input on June 4, 2023
metadata
Station Name: utqi00usa
Location: Utqiagvik (Barrow), Alaska, USA
Archives: BKG, CDDIS
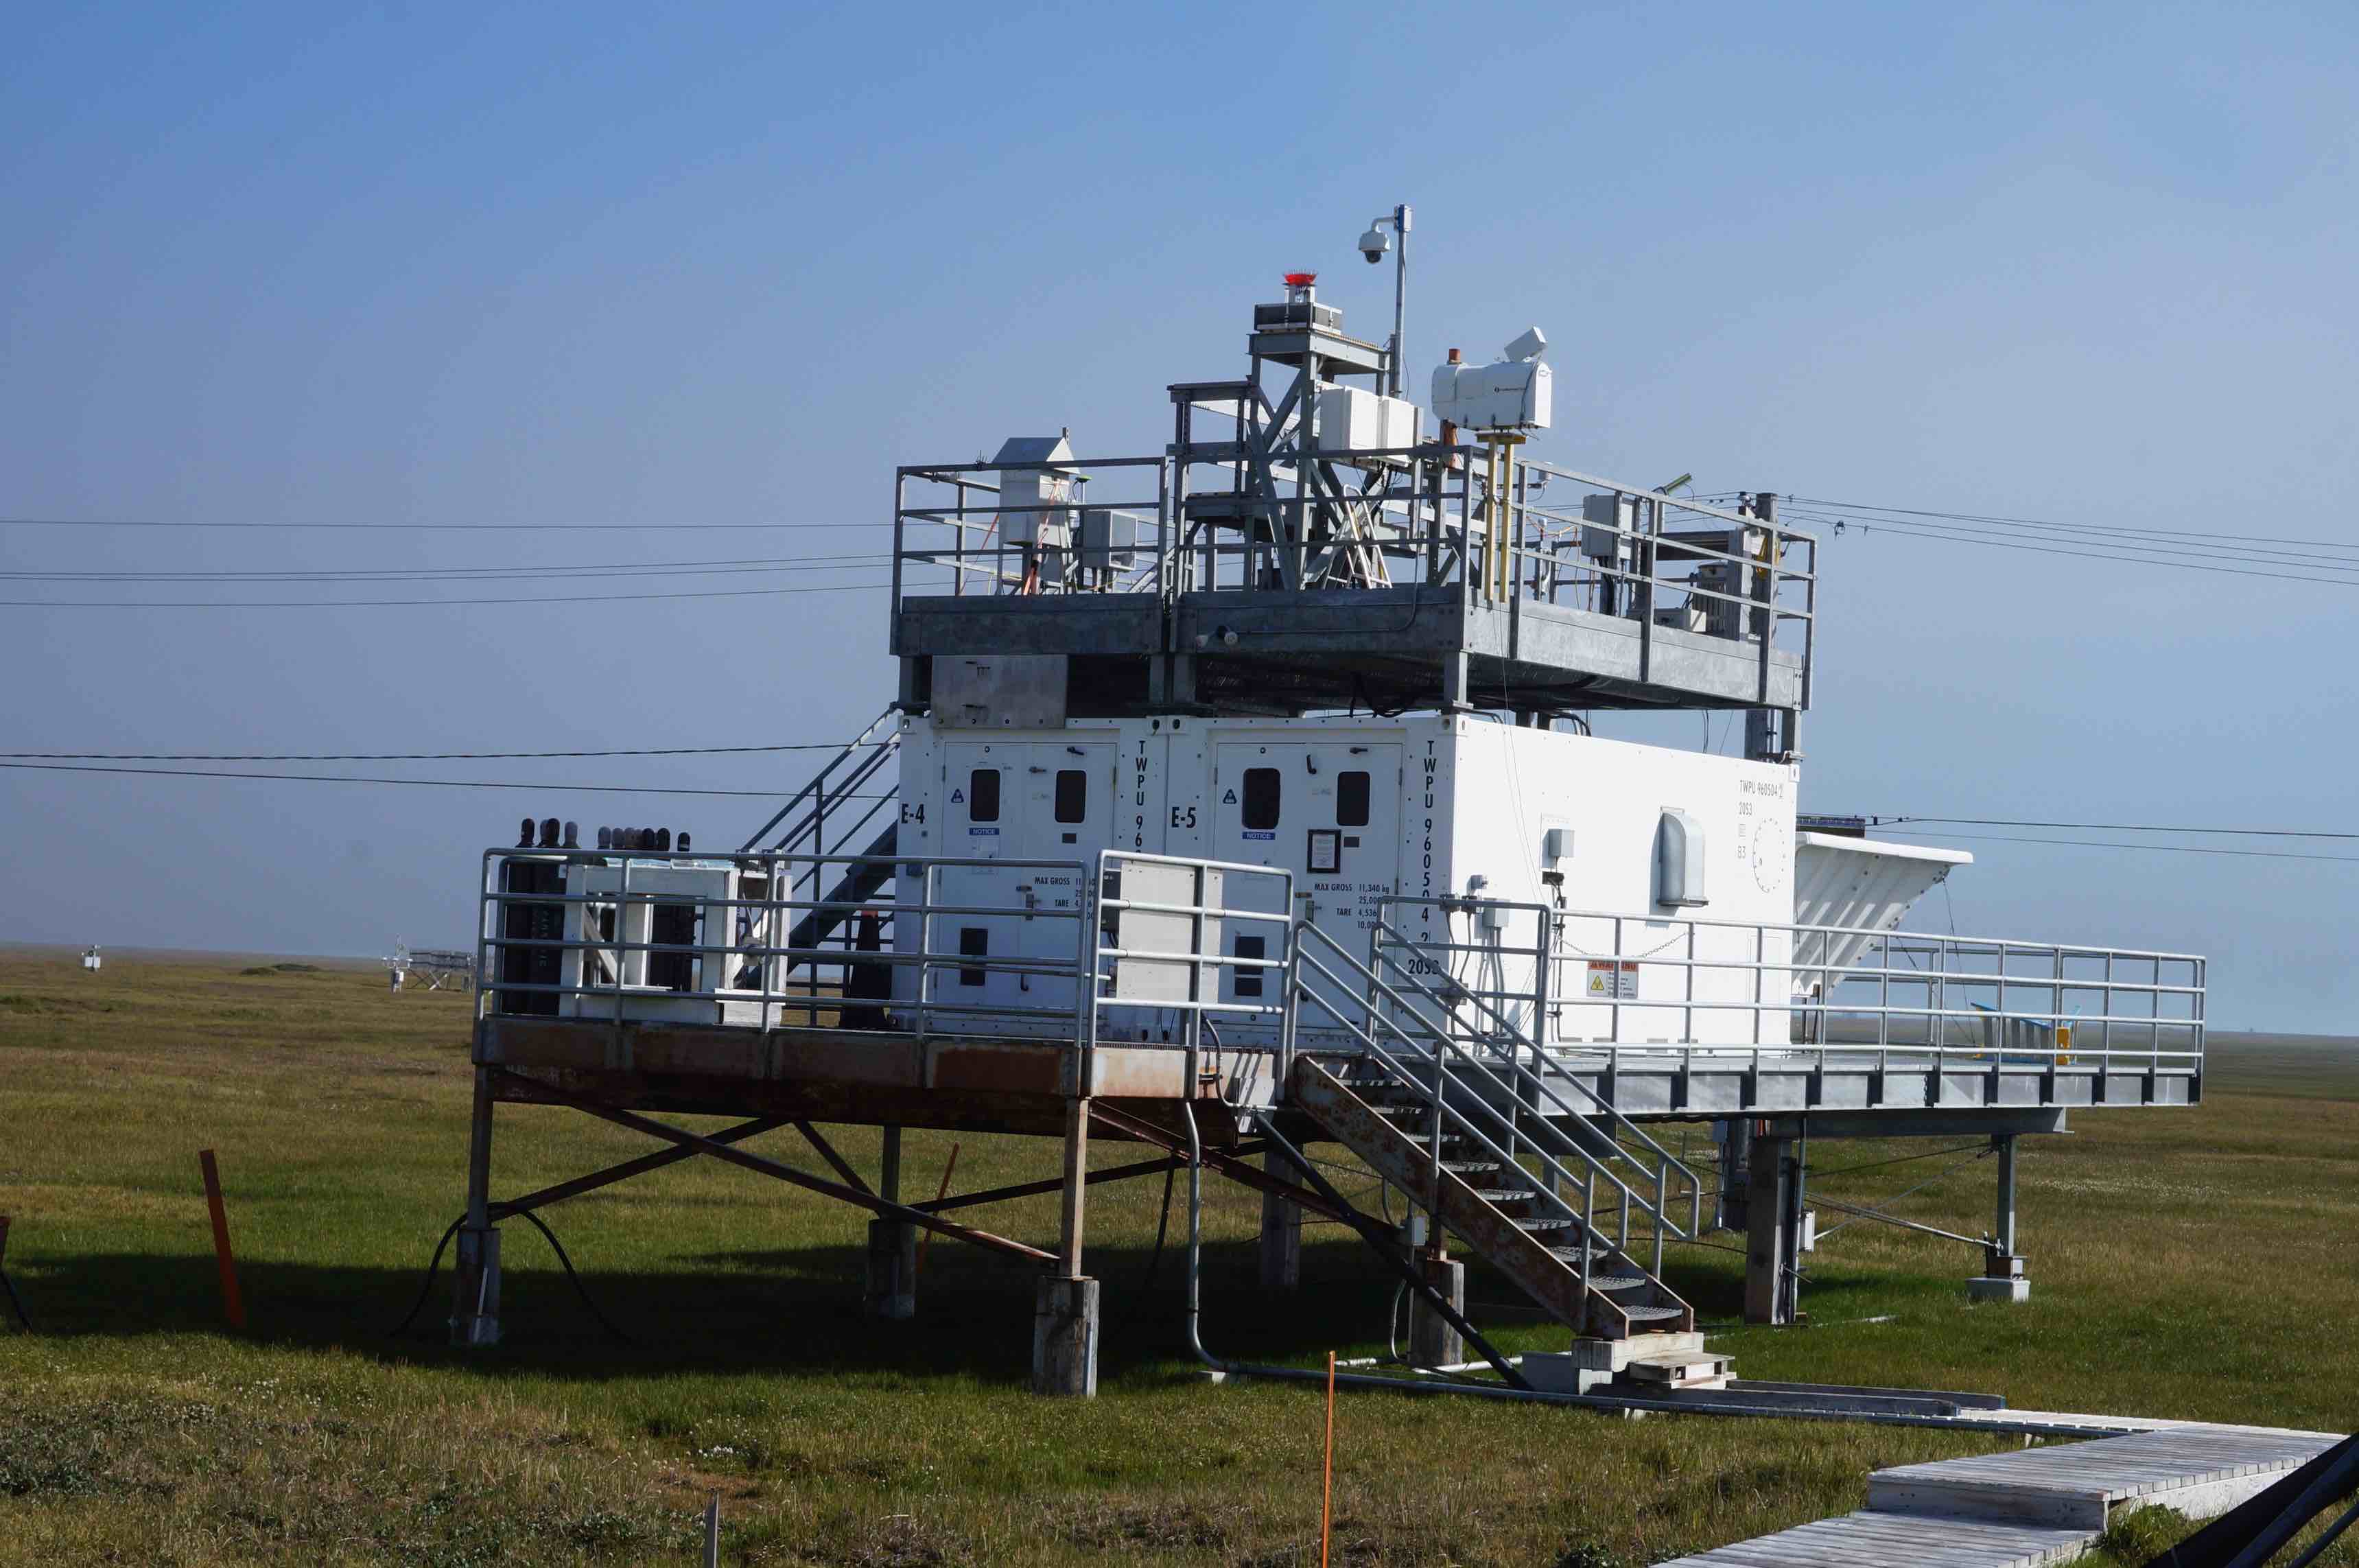
UTQI was installed by GFZ; it is part of their global GNSS network. It is located at the NOAA environmental facility. It is also an IGS site.
Use the web app to get an idea of the reflection zones at this site. Remember that the default is the elevation of the site above sea level. That might be ok - but it might not. Check with the real data. What azimuths should you use?
Look at the data
In order to have access to modern GNSS signals, we will use RINEX 3 files. First make a SNR file:
rinex2snr utqi00usa 2022 150 -orb rapid -archive bkg-igs
This will return a multi-GNSS SNR file, but only 30 second data. This restricts
the possible reflector heights, but is good enough for a start.
From the photograph, it looks that it is very possible the GNSS antenna is more than 6 meters
above the reflecting surface (the default in quickLook). And I will further restrict elevation
angles to 5-15 so as to avoid the building. I will set the reflection zone on the command line:
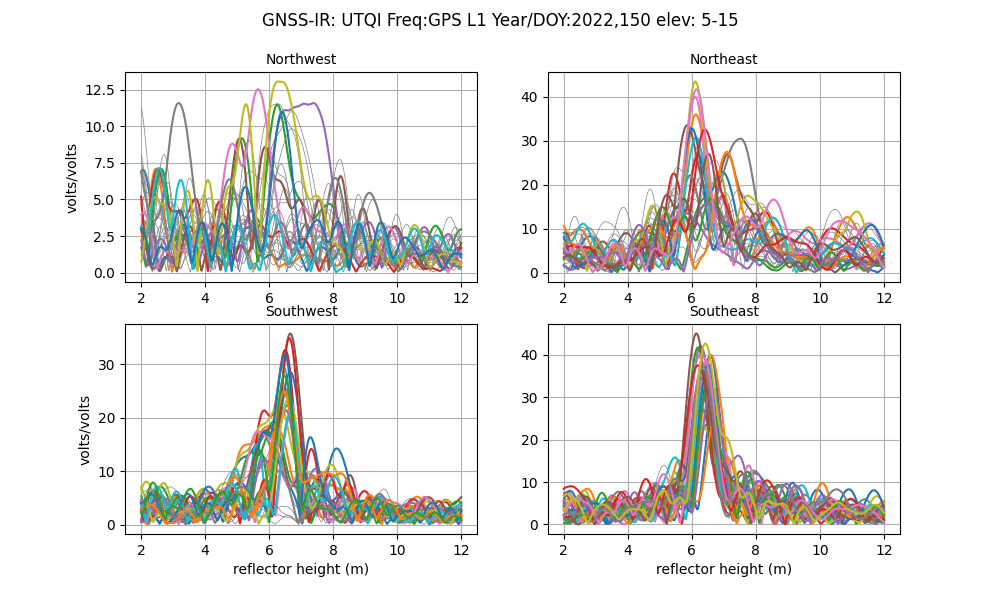
quickLook utqi 2022 150 -h1 2 -h2 12 -e1 5 -e2 15
I’ve outlined the “sweet spot” for reflections on the summary figure:
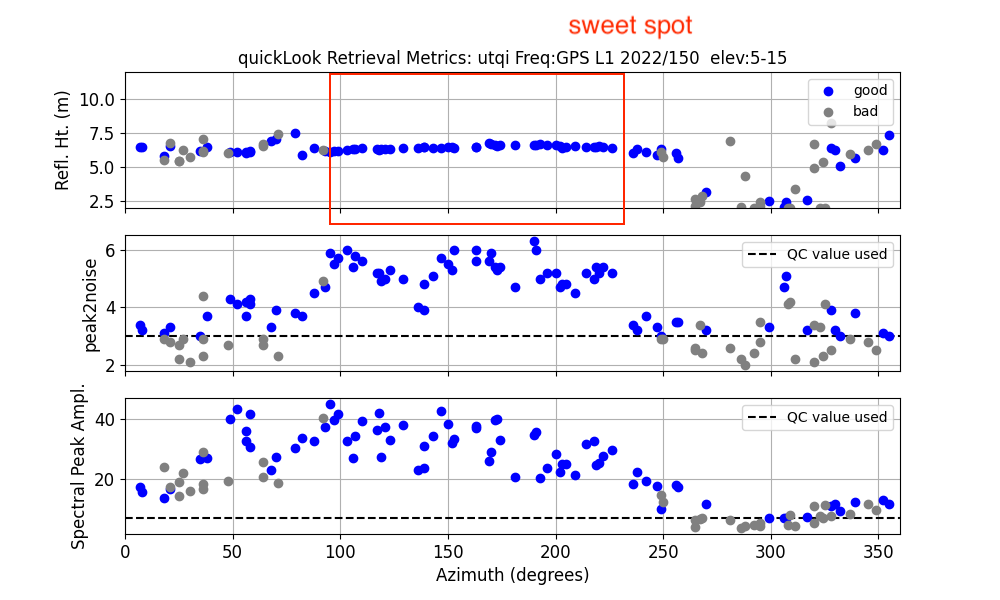
The main take home message: the a priori reflector height is a bit more than 6 meters. You can use that value within the reflection zone app if you want to look at the reflection zones again.
Make SNR files for multiple years
RINEX 3 files are available from both CDDIS and BKG. Here we selected CDDIS and multi-GNSS orbits. Another orbit option is rapid (also from GFZ). These files only become available in 2021, and I want to start the time series in 2020, so I opted to use gnss as the orbit source.
rinex2snr utqi00usa 2020 1 -orb gnss -archive cddis -year_end 2022 -doy_end 243
This won’t take too long since the data files are relatively small.
Estimate Reflector Height
Set your analysis strategy. I am using the main GPS signals, Glonass, and three Galileo frequencies:
gnssir_input utqi -h1 2 -h2 12 -e1 5 -e2 15 -frlist 1 20 5 101 102 201 205 207 T -azlist2 90 220
In retrospect, I should have limited the azimuths a little more. Now run the main module for estimating reflector height.
gnssir utqi 2020 1 -year_end 2022 -doy_end 243
Assess the results
Use the daily_avg module to consolidate your results and estimate snow accumulation. I am using
a median value of 50 cm and a minimum of 50 retrievals. You can certainly play with those parameters.
daily_avg utqi 0.5 50
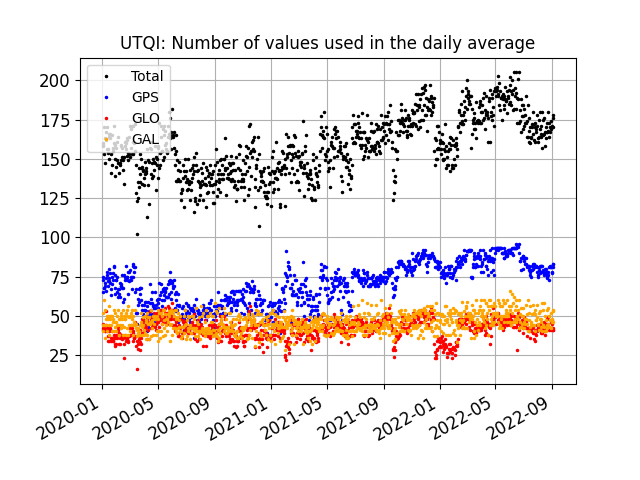
This summary shows you how much each constellation is contributing to the daily average (GPS, Galileo, Glonass).
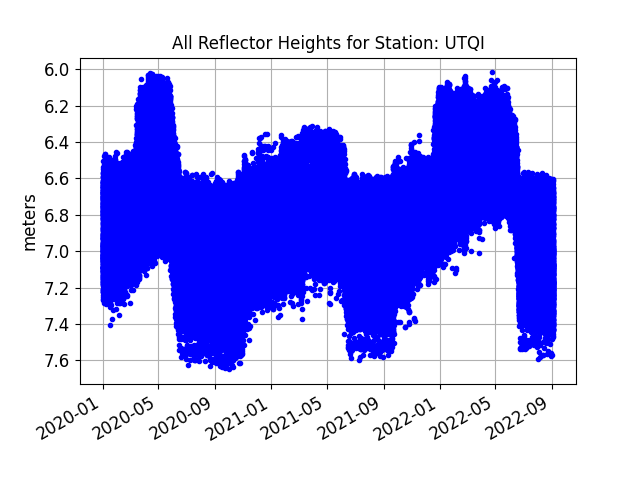
All the retrievals are shown here:
Finally, the daily average from 2020 to the present:
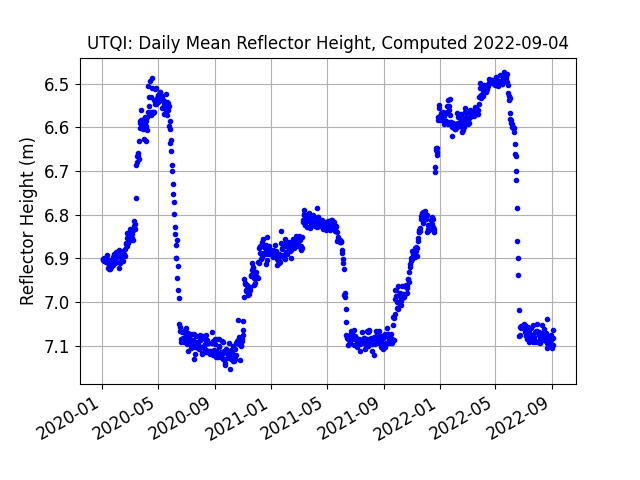
The final RH values are written to a file and the location of the file is written to the screen. How do you turn these RH estimates into snow accumulation? Set the fall values (before the first snow) as your zero point and then simply subtract. Why are RH values changing during the summer? This is related to permafrost active layer changes. Lin Liu’s group at the University of Hong Kong has pioneered the use of GNSS-IR to study this effect. There are a few papers on my website from this early work; more papers can be found on his website.
You can further restrict azimuths in daily_avg if you would like.
And there is certainly no reason you can’t download/translate the fall 2019
data to have the pre-snow level.
Warning: I found cases where the archived files are missing SNR data entirely. This will show up on the screen as failure to translate the RINEX 3 file into RINEX 2.
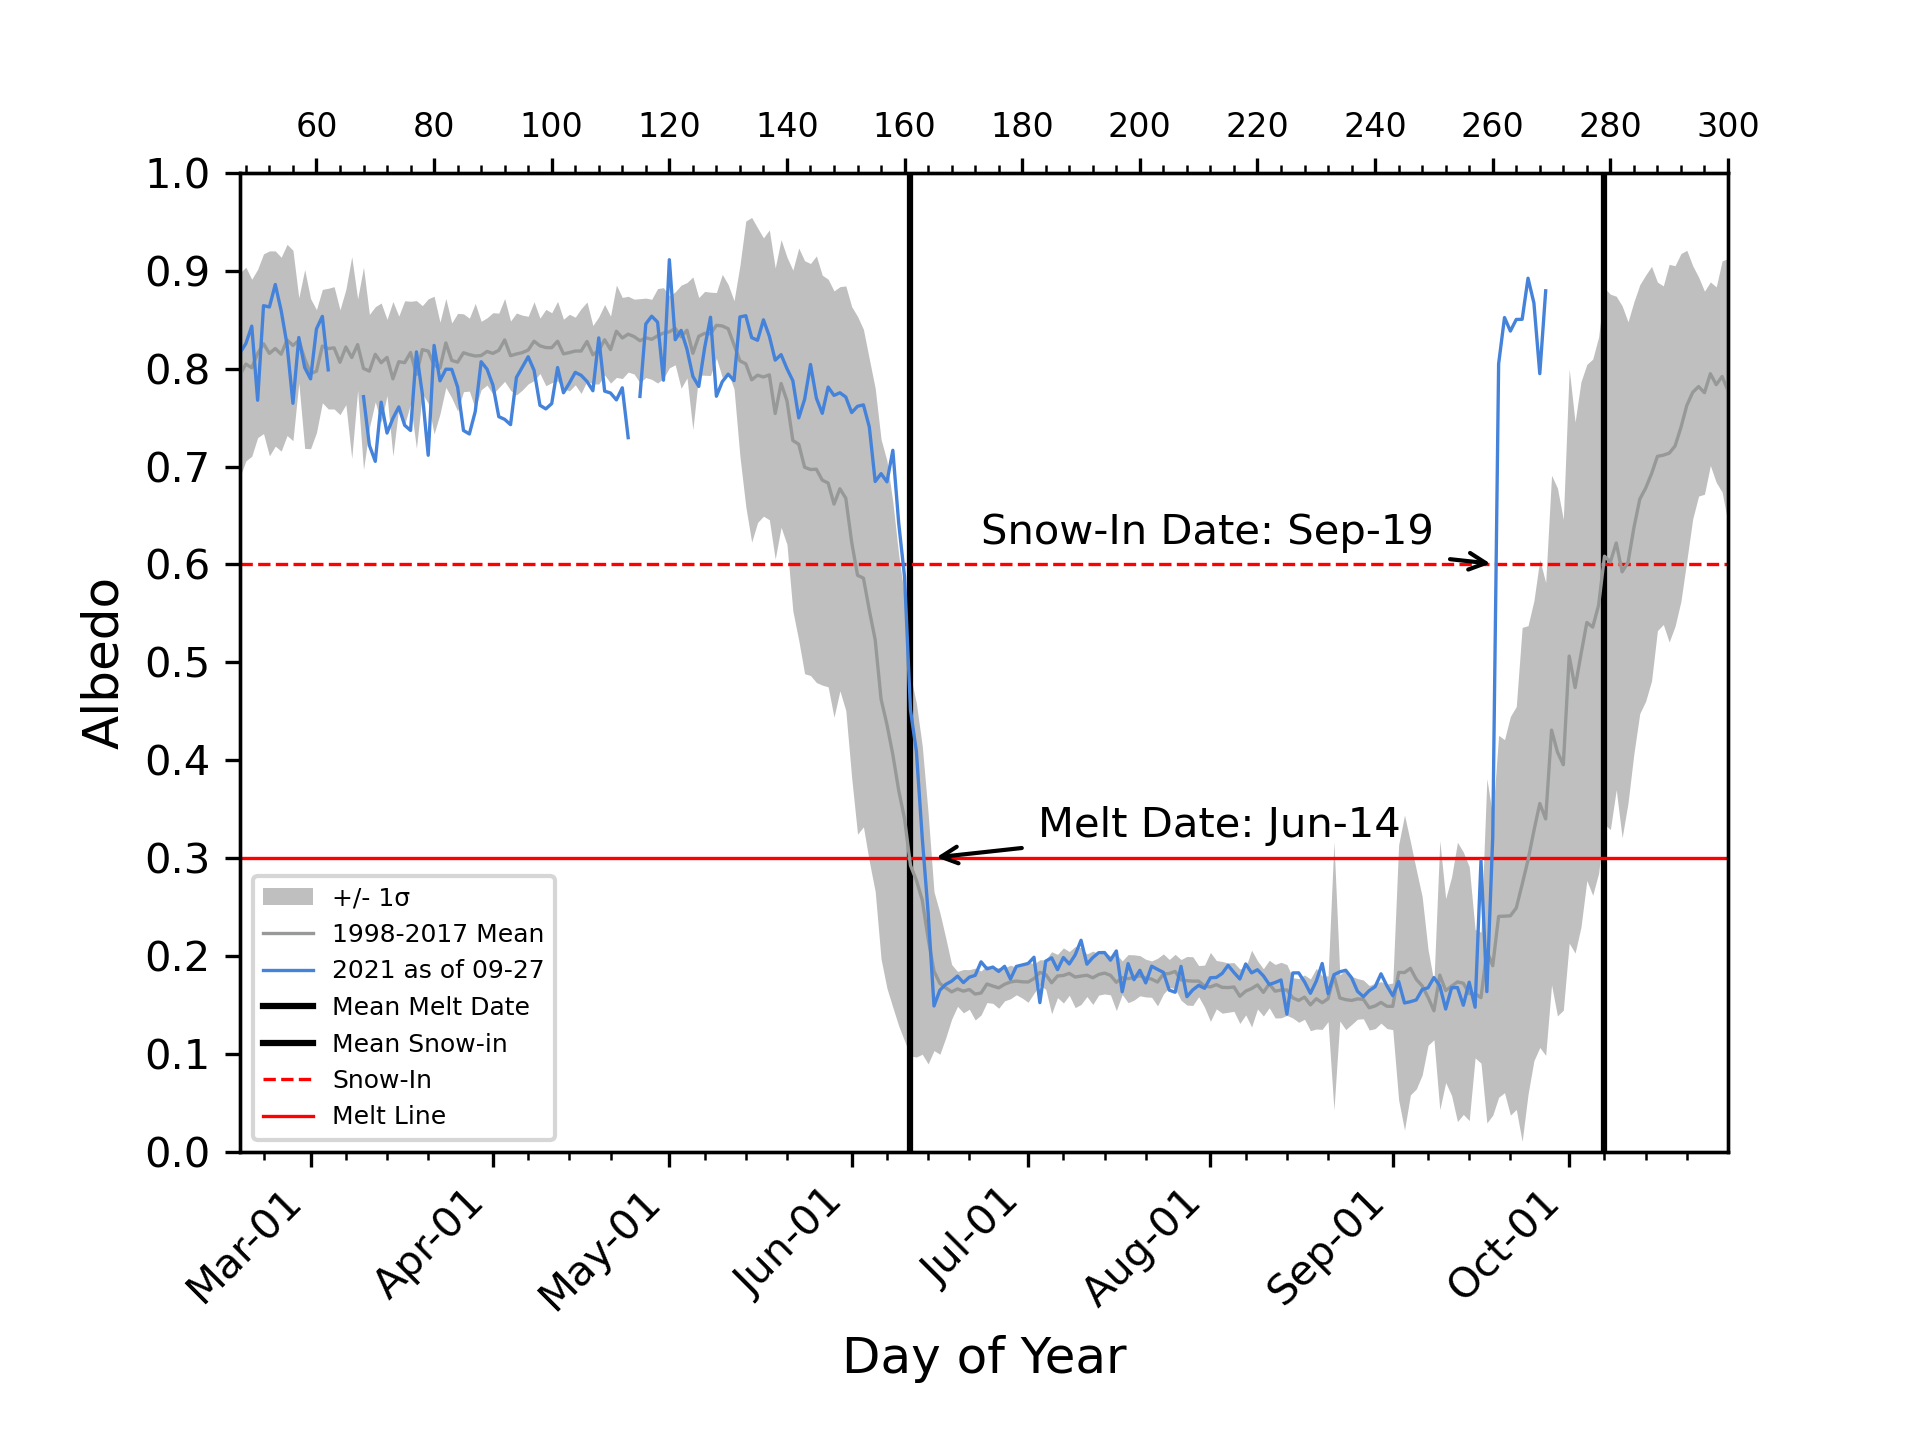
I found this NOAA plot online that detects the melt and snow-in dates:
Kristine M. Larson September 4, 2022
Possible in situ data
https://www.nohrsc.noaa.gov/interactive/html/graph.html?units=0&ey=2024&em=2&ed=9&eh=6&station=BROA2