Phoenix, Antarctica
phnx

Station Name: phnx
Location: Phoenix, Antarctica
Archive: UNAVCO
Station Page at Nevada Geodetic Laboratory
Experiment
phnx was installed at the same time as a dedicated snow measurement experiment called the Antarctic Precipitation System. We can see from this figure from their paper that the other instruments around (and above) the GPS antenna would obstruct GPS reflections in some sense:
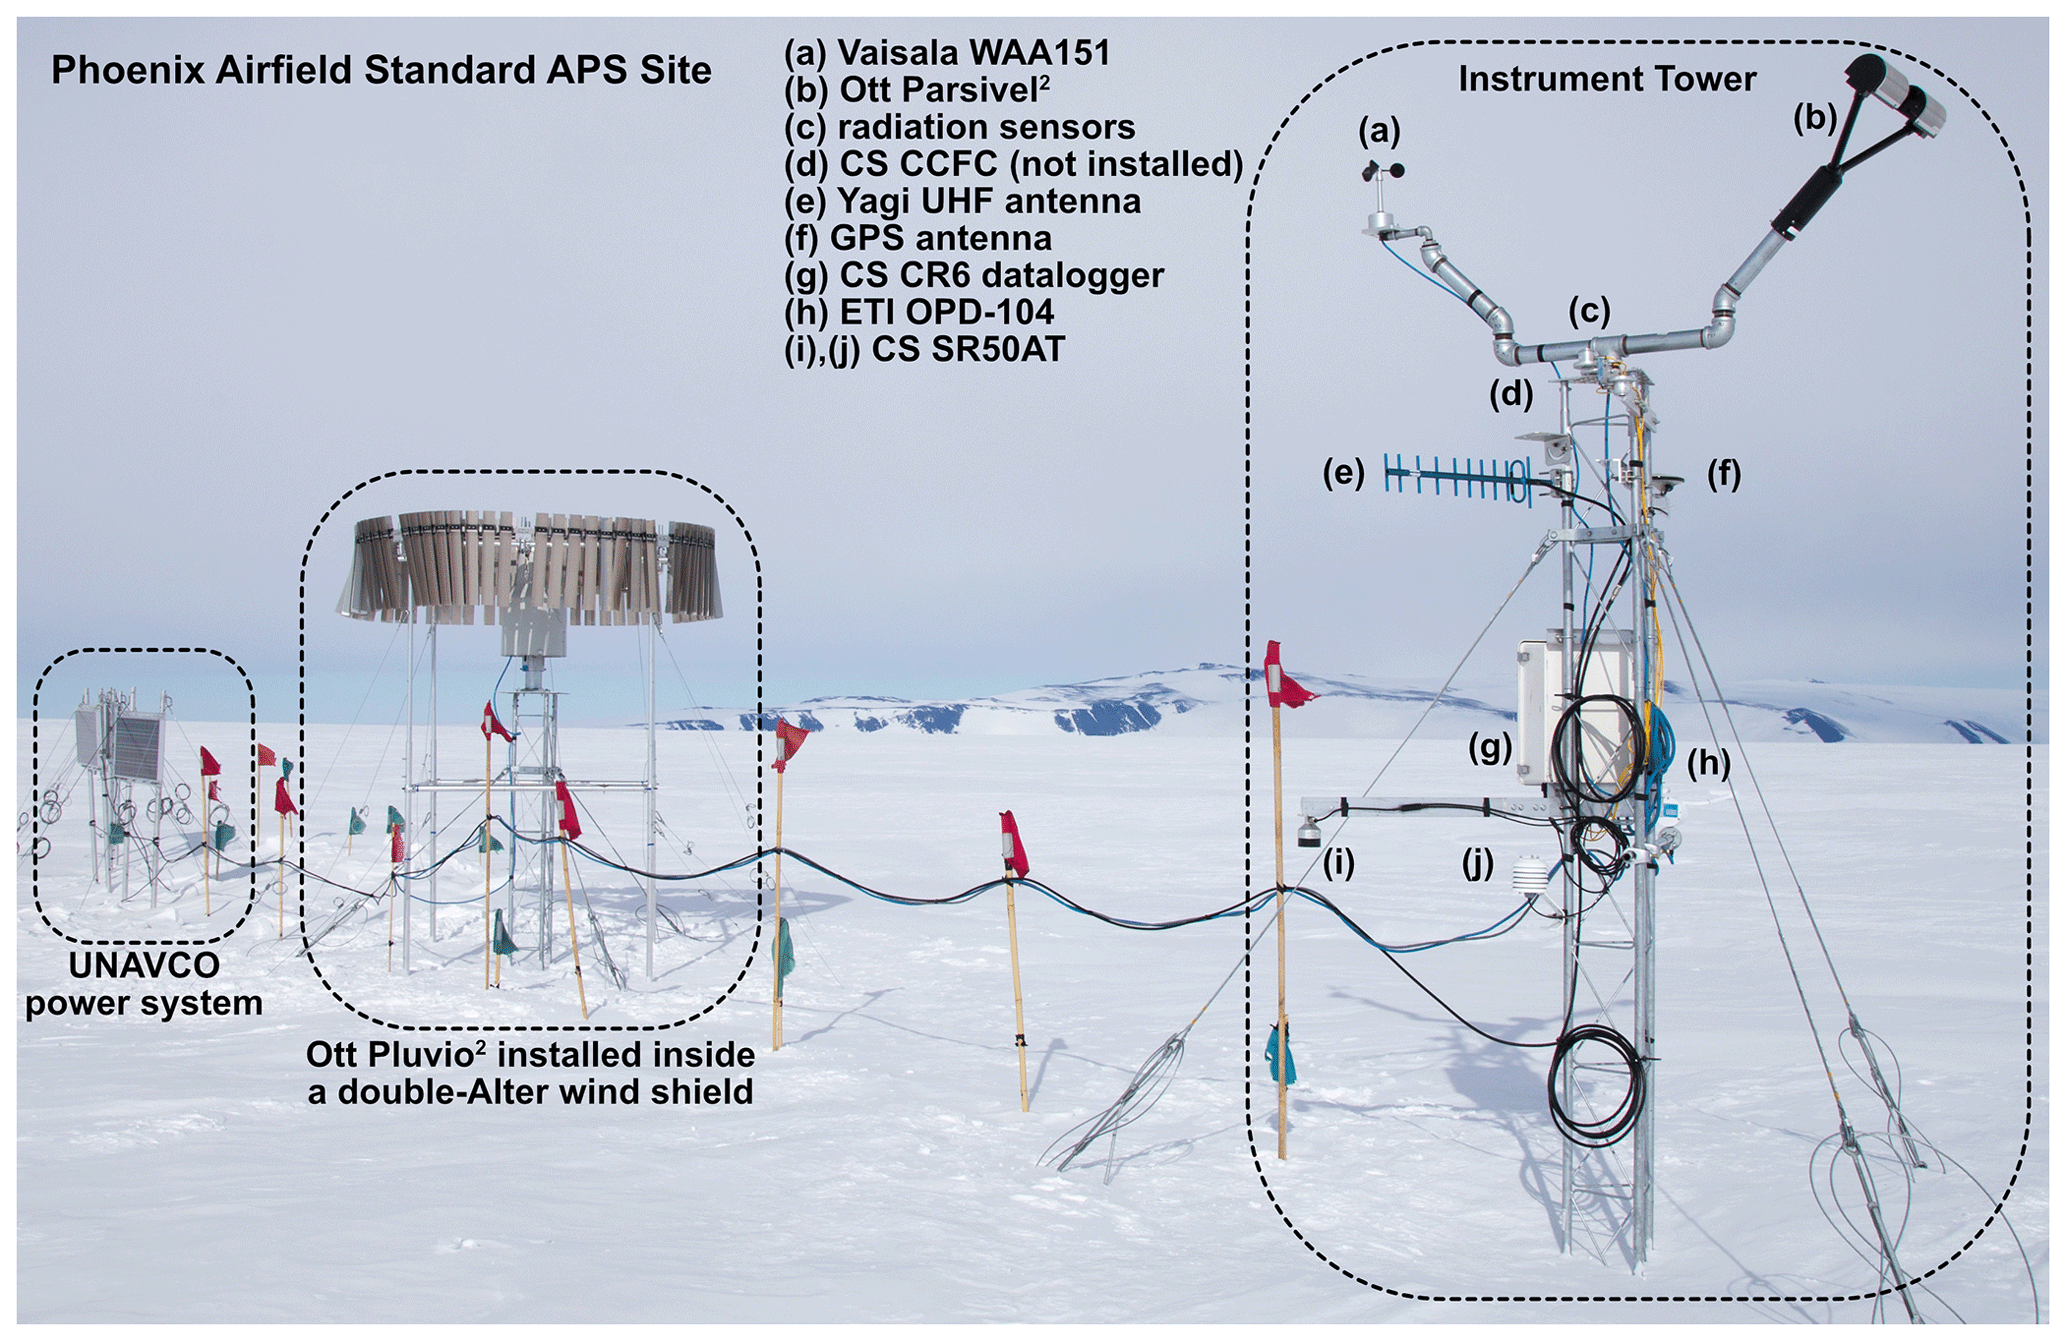
However, we will take this as an opportunity to see if we can see how the clutter impacts the GNSS-IR results. The paper says the Antarctic Precipitation System removed their instruments by 3 December 2019.
Let’s Take a Look at the Data
First make a SNR file.
rinex2snr phnx 2021 1
This will download the data from UNAVCO, translate into a SNR format. The command only uses GPS satellites. At my request, UNAVCO tracked good GPS signals (L2C and L5). We will use both of those and L1.
Now use quickLook to produce a periodogram similar to the one in
the web app (For details on quickLook output).
quickLook is set to use the L1 frequency by default:
quickLook phnx 2021 1
First, the lomb scargle periodograms for each quadrant which indicate that things are looking pretty good. Remember that each color is a different satellite arc.

The summary plot shows consistent reflector height retrievals (top plot):
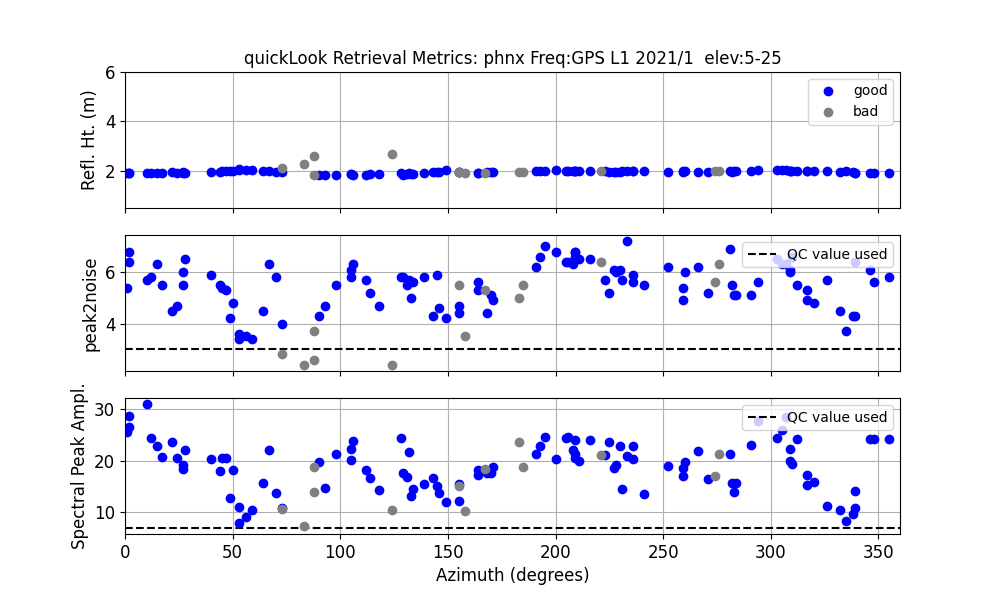
Pretty sweet. It looks like all azimuths are pretty good. There are some low amplitudes and peak2noise ratios at certain azimuths. Some of these are caused by the way we have split the tracks into strict azimuths (0-90,90-180, and so on). However, these periodograms look a lot better than we saw on the gnss-reflections webapp example:
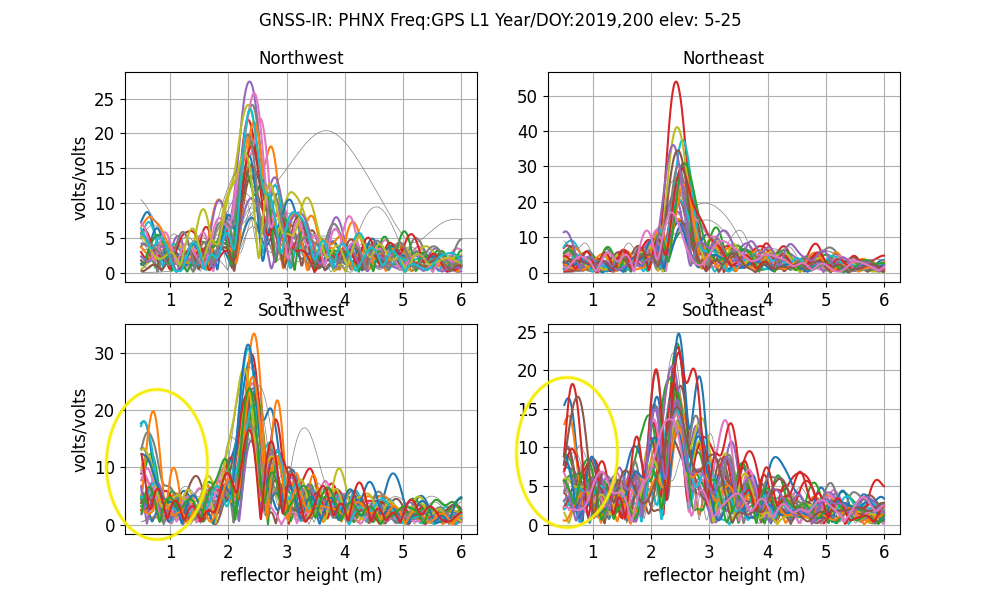
I have circled in bright yellow the parts of the periodograms that are noise. These
are primarily bunched at a little less than one meter reflector height.
Our theory is that this was created by the other sensors set out by the Antarctic Precipitation System.
Let’s run quickLook again a few weeks after they removed their equipment:
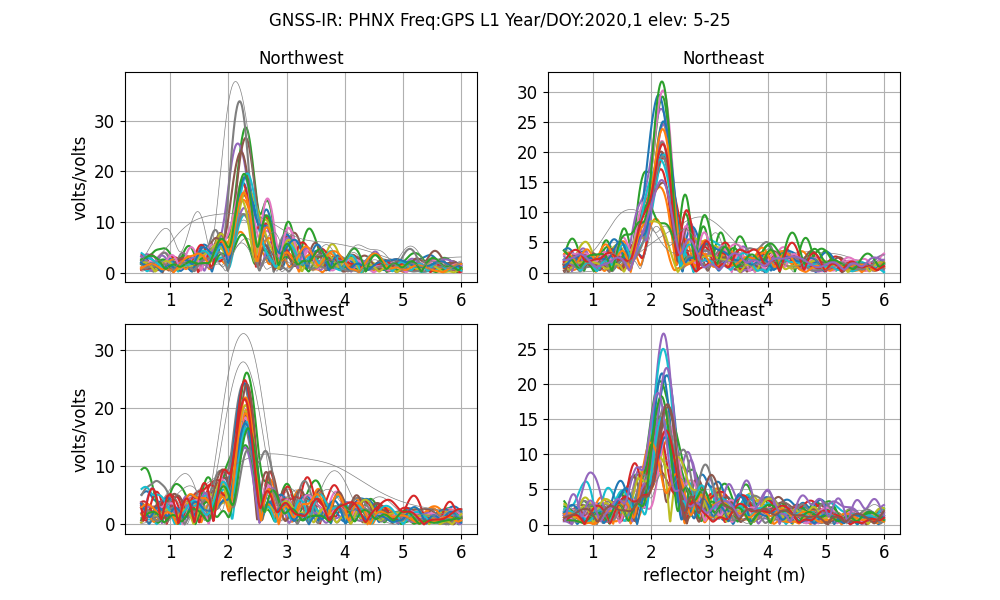
You can see that that particular noise source is now gone. And the periodograms in general are more clearly showing a strong single peak. This is an indication that closely co-colocating all these sensors negatively impacted the GPS reflections sensor. However, the dominant GPS reflections are still be tracked.
Analyze the Data
Now prepare to analyze the data using gnssir.
First you need to create a set of analysis instructions.
The default settings only need the station name. Originally the software required you to
input the station coordinates. If you believe that the Nevada Reno group has the site in its database, you can
avoid that step:
gnssir_input phnx
The json output will be stored in $REFL_CODE/input/phnx/phnx.json. The default peak to noise ratio is 2.7 - which is better for water. Since these are ice/snow reflections, I’m going to increase it a bit to 3.2 and require a larger amplitude. I am also selecting the azimuth region from 0 to 320.
gnssir_input phnx -ampl 10 -peak2noise 3.2 -azlist2 0 320
Next we need to make some snr files. I am going to do most of 2019 thru 2021, but if you prefer, you can set the -weekly option to True and that will speed things up (it makes one file per week). This command will go from day 1 in 2019 to day 150 in the year 2021.
rinex2snr phnx 2020 1 -doy_end 150 -year_end 2021
Run the gnssir:
gnssir phnx 2020 1 -year_end 2021 -doy_end 150
It takes a couple seconds to run gnssir for one day of data - so you will have to wait
five minutes or so for two and a half years of data to run. At that point you want to compute a daily
average reflector height:
daily_avg phnx 0.2 100 will create a daily average reflector height using a
median filter of 0.2 meters to remove outliers. The 100 input says you require 100 arcs to have confidence
in the average. You can vary these parameters to better see what is going on.

A file with the reflector height results is created by daily_avg; that is what
you use to measure snow accumulation using GNSS-IR!
A big thank you to Thomas Nylen for his efforts on installing and maintaining this site. I believe NSF funded the installation of this GPS site (PLR 1543377 and PLR 1543325). The GPS data are completely open. Please contact UNAVCO if you have difficulty finding them.
Kristine M. Larson March 16, 2022